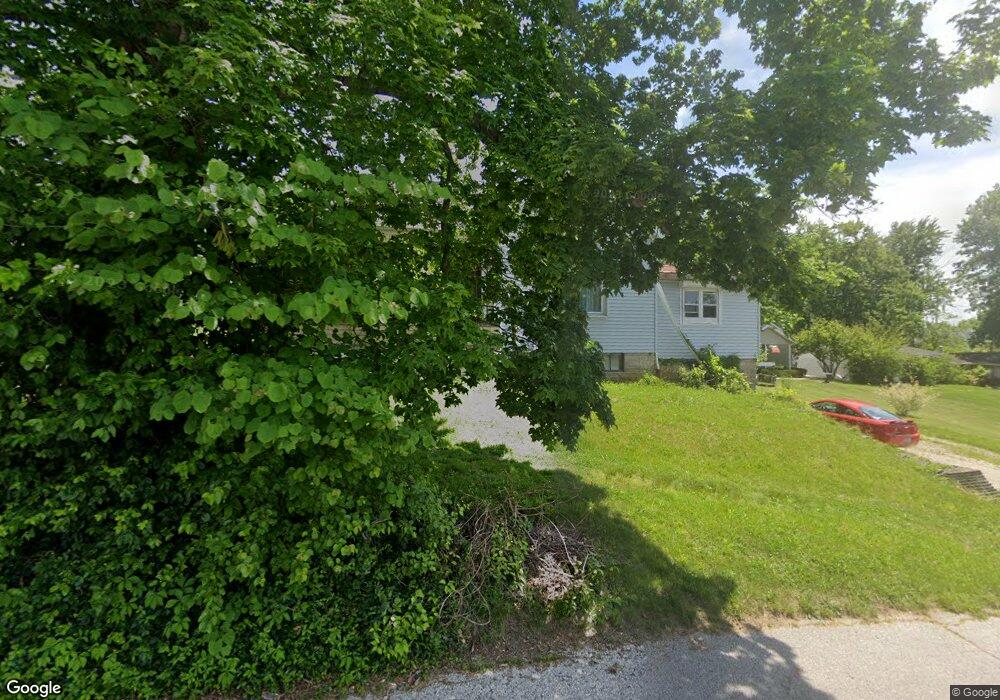
2004 J St Bedford, IN 47421
Estimated Value: $144,753 - $175,000
3
Beds
1
Bath
2,336
Sq Ft
$67/Sq Ft
Est. Value
About This Home
This home is located at 2004 J St, Bedford, IN 47421 and is currently estimated at $155,688, approximately $66 per square foot. 2004 J St is a home located in Lawrence County with nearby schools including Bedford North Lawrence High School, St. Vincent de Paul School, and Stone City Christian Academy.
Ownership History
Date
Name
Owned For
Owner Type
Purchase Details
Closed on
Sep 15, 2009
Sold by
Federal National Mortgage Association
Bought by
Hatfield Tonya
Current Estimated Value
Purchase Details
Closed on
Jan 12, 2009
Sold by
Wells Fargo Bank Na Business
Bought by
Federal National Mortgage Association
Purchase Details
Closed on
Nov 25, 2008
Sold by
Craig Samuel J
Bought by
Wells Fargo Bank Na Business
Create a Home Valuation Report for This Property
The Home Valuation Report is an in-depth analysis detailing your home's value as well as a comparison with similar homes in the area
Home Values in the Area
Average Home Value in this Area
Purchase History
| Date | Buyer | Sale Price | Title Company |
|---|---|---|---|
| Hatfield Tonya | $23,000 | Title Management Llc | |
| Tonya Hatfield | $23,000 | Title Management Llc | |
| Federal National Mortgage Association | $44,147 | Foutty & Foutty Llp | |
| Fannie Mae | $44,100 | Foutty & Foutty, Llp | |
| Wells Fargo Bank Na Business | $44,147 | Foutty & Foutty Llp | |
| Wells Fargo Bank Na Business | $44,100 | Foutty & Foutty, Llp |
Source: Public Records
Tax History
| Year | Tax Paid | Tax Assessment Tax Assessment Total Assessment is a certain percentage of the fair market value that is determined by local assessors to be the total taxable value of land and additions on the property. | Land | Improvement |
|---|---|---|---|---|
| 2025 | $835 | $99,200 | $9,400 | $89,800 |
| 2024 | $835 | $93,900 | $9,100 | $84,800 |
| 2023 | $743 | $87,000 | $8,900 | $78,100 |
| 2022 | $718 | $80,400 | $8,600 | $71,800 |
| 2021 | $619 | $71,700 | $8,400 | $63,300 |
| 2020 | $576 | $68,200 | $8,100 | $60,100 |
| 2019 | $567 | $65,700 | $7,800 | $57,900 |
| 2018 | $550 | $63,900 | $7,600 | $56,300 |
| 2017 | $1,226 | $61,300 | $7,500 | $53,800 |
| 2016 | $106 | $60,500 | $7,200 | $53,300 |
| 2014 | $93 | $59,200 | $7,200 | $52,000 |
Source: Public Records
Map
Nearby Homes
Your Personal Tour Guide
Ask me questions while you tour the home.