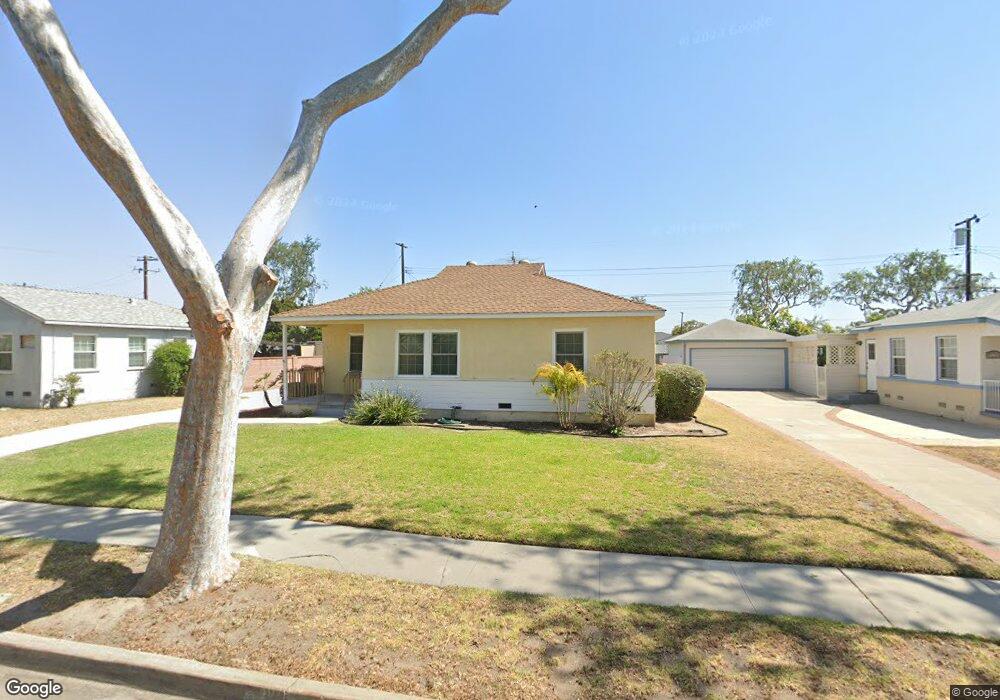
2004 W Ash Ave Fullerton, CA 92833
Estimated Value: $794,000 - $866,000
3
Beds
1
Bath
1,118
Sq Ft
$746/Sq Ft
Est. Value
About This Home
This home is located at 2004 W Ash Ave, Fullerton, CA 92833 and is currently estimated at $833,643, approximately $745 per square foot. 2004 W Ash Ave is a home located in Orange County with nearby schools including Pacific Drive Elementary School, Nicolas Junior High School, and Buena Park High School.
Ownership History
Date
Name
Owned For
Owner Type
Purchase Details
Closed on
Jan 30, 2008
Sold by
Alvarez Keith C
Bought by
Alvarez Keith C
Current Estimated Value
Home Financials for this Owner
Home Financials are based on the most recent Mortgage that was taken out on this home.
Original Mortgage
$335,697
Outstanding Balance
$211,527
Interest Rate
6.04%
Mortgage Type
New Conventional
Estimated Equity
$622,117
Purchase Details
Closed on
Sep 20, 2005
Sold by
Alvarez Margaret M
Bought by
Alvarez Keith C
Home Financials for this Owner
Home Financials are based on the most recent Mortgage that was taken out on this home.
Original Mortgage
$237,010
Interest Rate
5.72%
Mortgage Type
New Conventional
Purchase Details
Closed on
May 26, 1997
Sold by
Slaughter Dorothy Trust and Jacqueline
Bought by
Alvarez Keith C and Alvarez Margaret M
Home Financials for this Owner
Home Financials are based on the most recent Mortgage that was taken out on this home.
Original Mortgage
$145,860
Interest Rate
7.91%
Mortgage Type
VA
Create a Home Valuation Report for This Property
The Home Valuation Report is an in-depth analysis detailing your home's value as well as a comparison with similar homes in the area
Purchase History
| Date | Buyer | Sale Price | Title Company |
|---|---|---|---|
| Alvarez Keith C | -- | Southland Title Corporation | |
| Alvarez Keith C | -- | Commonwealth Land Title Co | |
| Alvarez Keith C | $152,090 | First American Title Ins Co |
Source: Public Records
Mortgage History
| Date | Status | Borrower | Loan Amount |
|---|---|---|---|
| Open | Alvarez Keith C | $335,697 | |
| Closed | Alvarez Keith C | $237,010 | |
| Closed | Alvarez Keith C | $145,860 |
Source: Public Records
Tax History
| Year | Tax Paid | Tax Assessment Tax Assessment Total Assessment is a certain percentage of the fair market value that is determined by local assessors to be the total taxable value of land and additions on the property. | Land | Improvement |
|---|---|---|---|---|
| 2025 | $2,804 | $237,777 | $178,287 | $59,490 |
| 2024 | $2,804 | $233,115 | $174,791 | $58,324 |
| 2023 | $2,733 | $228,545 | $171,364 | $57,181 |
| 2022 | $2,708 | $224,064 | $168,004 | $56,060 |
| 2021 | $2,661 | $219,671 | $164,710 | $54,961 |
| 2020 | $2,645 | $217,419 | $163,021 | $54,398 |
| 2019 | $2,580 | $213,156 | $159,824 | $53,332 |
| 2018 | $2,541 | $208,977 | $156,690 | $52,287 |
| 2017 | $2,498 | $204,880 | $153,618 | $51,262 |
| 2016 | $2,446 | $200,863 | $150,606 | $50,257 |
| 2015 | $2,380 | $197,846 | $148,343 | $49,503 |
| 2014 | $2,311 | $193,971 | $145,437 | $48,534 |
Source: Public Records
Map
Nearby Homes
- 2009 W Oak Ave
- 2100 W Valencia Dr
- 801 S Courtney Ave
- 1836 W Southgate Ave
- 2404 W Ash Ave
- 2321 Williamson Ave
- 1850 W Orangethorpe Ave
- 1850 W Orangethorpe Ave Unit 24
- 1850 W Orangethorpe Ave Unit 44
- 2380 W Orangethorpe Ave Unit 14
- 134 S Pritchard Ave
- 3604 W Valencia Dr
- 1422 Peckham St Unit A
- 3515 W Commonwealth Ave
- 1510 W Orangethorpe Ave
- 6921 Cottonwood Ln
- 6982 Crimson Dr
- 2540 W Picadilly Way
- 674 Bridgeport Cir Unit 25
- 2210 W Coronet Ave
- 2010 W Ash Ave
- 2000 W Ash Ave
- 501 S Courtney Ave
- 2016 W Ash Ave
- 2017 W Oak Ave
- 2005 W Ash Ave
- 2009 W Ash Ave
- 2001 W Ash Ave
- 2001 W Oak Ave
- 2023 W Oak Ave
- 500 S Courtney Ave
- 2020 W Ash Ave
- 2015 W Ash Ave
- 2031 W Oak Ave
- 420 S Courtney Ave
- 520 S Courtney Ave
- 2019 W Ash Ave
- 1932 W Ash Ave
- 2022 W Ash Ave
- 1933 W Ash Ave
Your Personal Tour Guide
Ask me questions while you tour the home.