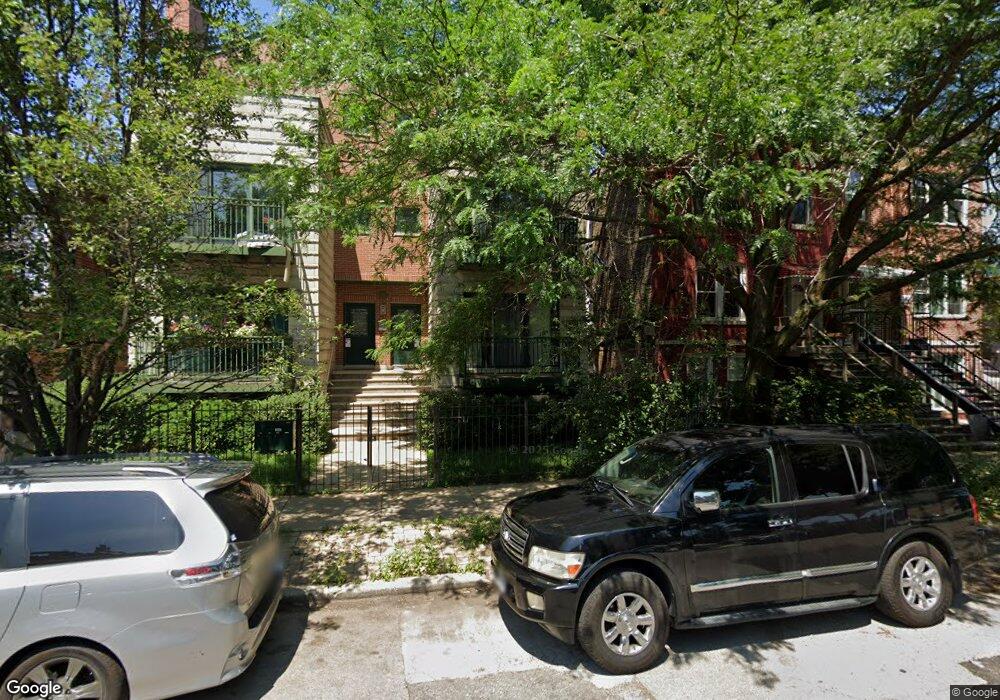
2004 W Huron St Unit 2W Chicago, IL 60612
West Town NeighborhoodEstimated Value: $557,000 - $701,000
3
Beds
3
Baths
1,900
Sq Ft
$329/Sq Ft
Est. Value
About This Home
This home is located at 2004 W Huron St Unit 2W, Chicago, IL 60612 and is currently estimated at $625,373, approximately $329 per square foot. 2004 W Huron St Unit 2W is a home located in Cook County with nearby schools including Talcott Elementary School, Wells Community Academy High School, and St Nicholas Cathedral.
Ownership History
Date
Name
Owned For
Owner Type
Purchase Details
Closed on
Jan 14, 2013
Sold by
Gunaratnam Martin R and Gunaratnam Miria R
Bought by
Gunaratnam Martin R and Gunaratnam Maria R
Current Estimated Value
Purchase Details
Closed on
Mar 21, 2008
Sold by
Integra Bank N A
Bought by
Gunaratnam Martina R and Gunaratnam Miria R
Home Financials for this Owner
Home Financials are based on the most recent Mortgage that was taken out on this home.
Original Mortgage
$412,250
Interest Rate
6.09%
Mortgage Type
Purchase Money Mortgage
Purchase Details
Closed on
Nov 11, 2004
Sold by
Cosmopolitan Bank & Trust
Bought by
Prairie Bank & Trust Co and Trust #02-112
Home Financials for this Owner
Home Financials are based on the most recent Mortgage that was taken out on this home.
Original Mortgage
$1,343,100
Interest Rate
5.77%
Mortgage Type
Construction
Create a Home Valuation Report for This Property
The Home Valuation Report is an in-depth analysis detailing your home's value as well as a comparison with similar homes in the area
Home Values in the Area
Average Home Value in this Area
Purchase History
| Date | Buyer | Sale Price | Title Company |
|---|---|---|---|
| Gunaratnam Martin R | -- | Citywide Title Corporation | |
| Gunaratnam Martina R | $450,000 | Stewart Title Insurance Comp | |
| Gunaratnam Martina R | $450,000 | Prism Title | |
| Staral David | $425,000 | Multiple | |
| Prairie Bank & Trust Co | $500,000 | Atgf Inc |
Source: Public Records
Mortgage History
| Date | Status | Borrower | Loan Amount |
|---|---|---|---|
| Previous Owner | Staral David | $412,250 | |
| Previous Owner | Gunaratnam Martina R | $360,000 | |
| Previous Owner | Prairie Bank & Trust Co | $1,343,100 |
Source: Public Records
Tax History Compared to Growth
Tax History
| Year | Tax Paid | Tax Assessment Tax Assessment Total Assessment is a certain percentage of the fair market value that is determined by local assessors to be the total taxable value of land and additions on the property. | Land | Improvement |
|---|---|---|---|---|
| 2024 | $7,928 | $38,143 | $7,271 | $30,872 |
| 2023 | $7,705 | $37,463 | $3,318 | $34,145 |
| 2022 | $7,705 | $37,463 | $3,318 | $34,145 |
| 2021 | $7,533 | $37,462 | $3,318 | $34,144 |
| 2020 | $5,992 | $26,897 | $3,318 | $23,579 |
| 2019 | $5,951 | $29,621 | $3,318 | $26,303 |
| 2018 | $5,851 | $29,621 | $3,318 | $26,303 |
| 2017 | $5,128 | $27,198 | $2,927 | $24,271 |
| 2016 | $4,947 | $27,198 | $2,927 | $24,271 |
| 2015 | $4,503 | $27,198 | $2,927 | $24,271 |
| 2014 | $4,647 | $27,616 | $2,488 | $25,128 |
| 2013 | $4,544 | $27,616 | $2,488 | $25,128 |
Source: Public Records
Map
Nearby Homes
- 2002 W Huron St
- 2044 W Superior St
- 2036 W Erie St
- 1934 W Superior St
- 1947 W Chicago Ave
- 1609 W Superior St
- 2002 W Ohio St
- 2059 W Erie St
- 1921 W Chicago Ave
- 2013 W Rice St Unit 3
- 819 N Damen Ave Unit 2
- 2127 W Huron St
- 2101 W Rice St Unit 402
- 2149 W Huron St
- 1830 W Huron St Unit 2
- 2035 W Race Ave
- 2053 W Race Ave
- 2049 W Race Ave
- 2055 W Race Ave
- 2059 W Race Ave
- 2004 W Huron St Unit 2E
- 2004 W Huron St Unit 1W
- 2004 W Huron St Unit 1E
- 2010 W Huron St
- 2014 W Huron St
- 2014 W Huron St Unit 1F
- 2014 W Huron St Unit CH
- 2014 W Huron St Unit 2F
- 2000 W Huron St
- 2000 W Huron St Unit 1
- 2016 W Huron St
- 2016 W Huron St
- 2013 W Superior St
- 2013 W Superior St Unit 1R
- 2011 W Superior St Unit 1WEST
- 2011 W Superior St Unit 2WEST
- 2011 W Superior St Unit 3WEST
- 2011 W Superior St Unit 1W
- 2011 W Superior St Unit 2W
- 2020 W Huron St