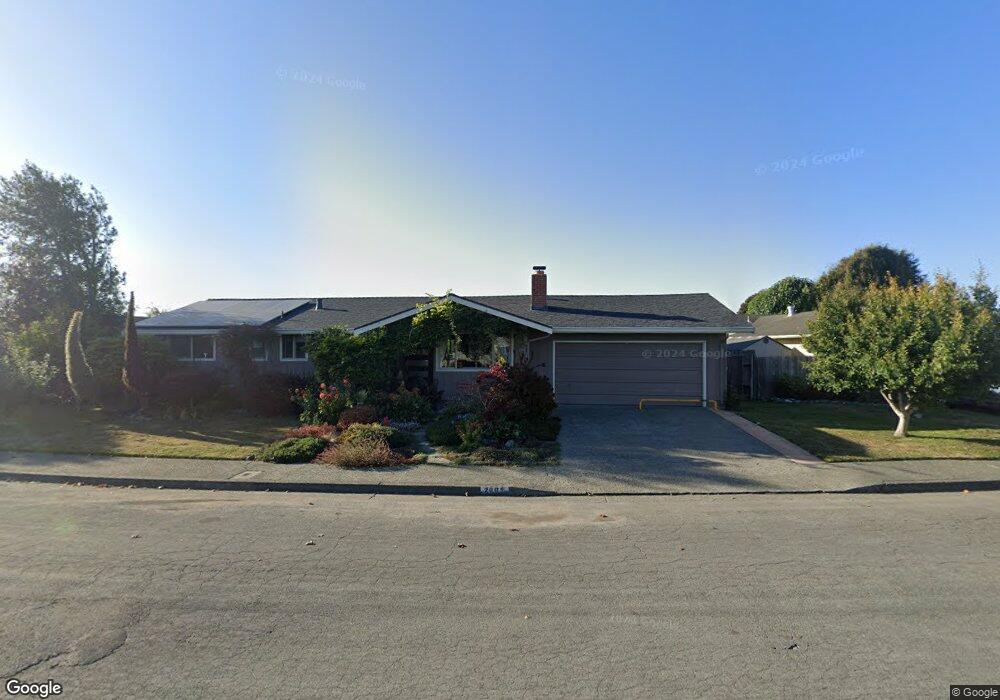
2005 Ernest Way Arcata, CA 95521
Estimated Value: $439,492 - $486,000
4
Beds
1
Bath
1,212
Sq Ft
$387/Sq Ft
Est. Value
About This Home
This home is located at 2005 Ernest Way, Arcata, CA 95521 and is currently estimated at $468,873, approximately $386 per square foot. 2005 Ernest Way is a home located in Humboldt County with nearby schools including Pacific Union Elementary School, Arcata High School, and Trillium Charter School.
Ownership History
Date
Name
Owned For
Owner Type
Purchase Details
Closed on
Jun 13, 2024
Sold by
Weller Theodore J and Mogel Catherine A
Bought by
Weller-Mogel Family Trust and Weller
Current Estimated Value
Purchase Details
Closed on
Apr 15, 2002
Sold by
Bishop Emma D and Emma Delores Bishop 1997 Trust
Bought by
Weller Theodore J and Mogel Catherine A
Home Financials for this Owner
Home Financials are based on the most recent Mortgage that was taken out on this home.
Original Mortgage
$152,800
Interest Rate
6.94%
Purchase Details
Closed on
Aug 8, 1997
Sold by
Bishop Emma D
Bought by
Bishop Emma D and Emma Delores Bishop 1997 Trust
Create a Home Valuation Report for This Property
The Home Valuation Report is an in-depth analysis detailing your home's value as well as a comparison with similar homes in the area
Purchase History
| Date | Buyer | Sale Price | Title Company |
|---|---|---|---|
| Weller-Mogel Family Trust | -- | None Listed On Document | |
| Weller Theodore J | $191,000 | Humboldt Land Title Company | |
| Bishop Emma D | -- | -- |
Source: Public Records
Mortgage History
| Date | Status | Borrower | Loan Amount |
|---|---|---|---|
| Previous Owner | Weller Theodore J | $152,800 |
Source: Public Records
Tax History
| Year | Tax Paid | Tax Assessment Tax Assessment Total Assessment is a certain percentage of the fair market value that is determined by local assessors to be the total taxable value of land and additions on the property. | Land | Improvement |
|---|---|---|---|---|
| 2025 | $3,029 | $282,142 | $103,399 | $178,743 |
| 2024 | $3,029 | $276,611 | $101,372 | $175,239 |
| 2023 | $3,027 | $271,188 | $99,385 | $171,803 |
| 2022 | $3,010 | $265,872 | $97,437 | $168,435 |
| 2021 | $2,992 | $260,660 | $95,527 | $165,133 |
| 2020 | $2,882 | $257,988 | $94,548 | $163,440 |
| 2019 | $2,836 | $252,931 | $92,695 | $160,236 |
| 2018 | $2,651 | $247,973 | $90,878 | $157,095 |
| 2017 | $2,609 | $243,112 | $89,097 | $154,015 |
| 2016 | $2,564 | $238,346 | $87,350 | $150,996 |
| 2015 | $2,517 | $234,766 | $86,038 | $148,728 |
| 2014 | $2,479 | $230,168 | $84,353 | $145,815 |
Source: Public Records
Map
Nearby Homes
- 3106 Brian Ct
- 2203 Appaloosa Ln
- 3735 Shetland Ln
- 2084 Mustang Ln
- 2078 Shetland Ln
- 3659 Spear Ave
- 3301 Antoinette Ct
- 3030 Alliance Rd
- 1254 Mccallum Cir
- 3028 Alliance Rd
- 1283 Poplar Dr
- 1082 Cedar Dr
- 00 Mad River Pkwy
- 4965 Monterey Dr
- 3122 St Louis Rd
- 1666 Stewart Ave
- 2700 Meadow Creek Way
- 970 Courtyard Cir
- 812 Diamond Dr
- 330 California Ave
- 1999 Ernest Way
- 2009 Ernest Way
- 3155 Alice Ave
- 1995 Ernest Way
- 3173 Alice Ave
- 3135 Alice Ave
- 2000 Ernest Way
- 3181 Alice Ave
- 2008 Ernest Way
- 2004 Ernest Way
- 2006 Ernest Way
- 1991 Ernest Way
- 1996 Ernest Way
- 2012 Ernest Way
- 3189 Alice Ave
- 1988 Ernest Way
- 1987 Ernest Way
- 3144 Alice Ave
- 1993 Edith Dr
- 2023 Ernest Way
Your Personal Tour Guide
Ask me questions while you tour the home.