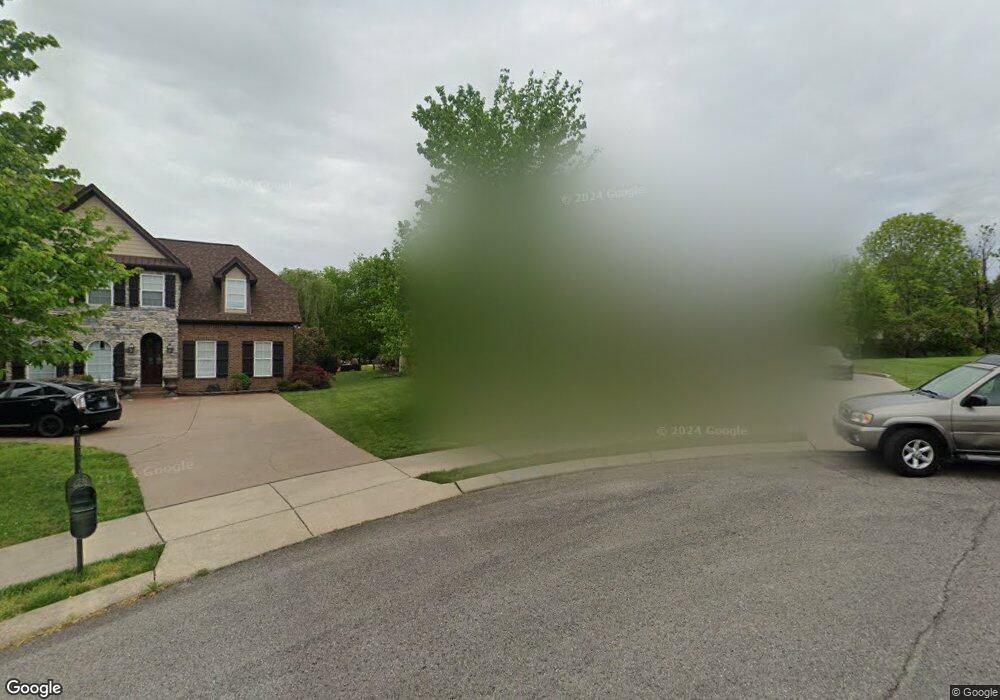
2005 Fishers Loop Spring Hill, TN 37174
Estimated Value: $832,000 - $1,070,000
Studio
4
Baths
3,279
Sq Ft
$277/Sq Ft
Est. Value
About This Home
This home is located at 2005 Fishers Loop, Spring Hill, TN 37174 and is currently estimated at $908,895, approximately $277 per square foot. 2005 Fishers Loop is a home located in Williamson County with nearby schools including Primrose School of Spring Hill and Columbia Academy at Spring Hill.
Ownership History
Date
Name
Owned For
Owner Type
Purchase Details
Closed on
Dec 5, 2024
Sold by
Canpari Jan and Canepari Jan
Bought by
Canepari Jan
Current Estimated Value
Purchase Details
Closed on
Jun 28, 2011
Sold by
Ulmer Joel E and Ulmer Leanne S
Bought by
Canepari James and Canapari Jan
Home Financials for this Owner
Home Financials are based on the most recent Mortgage that was taken out on this home.
Original Mortgage
$367,175
Interest Rate
4.62%
Mortgage Type
New Conventional
Purchase Details
Closed on
Jun 7, 2007
Sold by
The Hughes Group Llc
Bought by
Ulmer Joel E and Ulmer Leanne S
Home Financials for this Owner
Home Financials are based on the most recent Mortgage that was taken out on this home.
Original Mortgage
$235,000
Interest Rate
6.16%
Mortgage Type
Purchase Money Mortgage
Create a Home Valuation Report for This Property
The Home Valuation Report is an in-depth analysis detailing your home's value as well as a comparison with similar homes in the area
Home Values in the Area
Average Home Value in this Area
Purchase History
| Date | Buyer | Sale Price | Title Company |
|---|---|---|---|
| Canepari Jan | -- | None Listed On Document | |
| Canepari Jan | -- | None Listed On Document | |
| Canepari James | $386,500 | Foundation Title | |
| Ulmer Joel E | $427,900 | Heritage Title |
Source: Public Records
Mortgage History
| Date | Status | Borrower | Loan Amount |
|---|---|---|---|
| Previous Owner | Canepari James | $367,175 | |
| Previous Owner | Ulmer Joel E | $235,000 |
Source: Public Records
Tax History
| Year | Tax Paid | Tax Assessment Tax Assessment Total Assessment is a certain percentage of the fair market value that is determined by local assessors to be the total taxable value of land and additions on the property. | Land | Improvement |
|---|---|---|---|---|
| 2025 | $1,038 | $209,950 | $53,750 | $156,200 |
| 2024 | $1,038 | $140,425 | $30,000 | $110,425 |
| 2023 | $1,038 | $140,425 | $30,000 | $110,425 |
| 2022 | $2,570 | $140,425 | $30,000 | $110,425 |
| 2021 | $2,570 | $140,425 | $30,000 | $110,425 |
| 2020 | $2,494 | $115,450 | $23,750 | $91,700 |
| 2019 | $2,494 | $115,450 | $23,750 | $91,700 |
| 2018 | $2,413 | $115,450 | $23,750 | $91,700 |
| 2017 | $2,300 | $111,125 | $23,750 | $87,375 |
Source: Public Records
Map
Nearby Homes
- 1766 Witt Way Dr
- 1816 Elizabeth Ct
- 998 Spruce Ridge Ln
- 1006 Autumn Ridge Ct
- 3007 Arbuckle Ln
- 4007 Pendleton Dr
- 1637 Witt Hill Dr
- 5090 Main St
- 3041 Everleigh Place
- 966 Carnation Dr
- 8008 Puddleduck Ln
- 1818 Witt Way Dr
- 1822 Witt Way Dr
- 1706 Sorrell Park Dr
- 2993 Elkhorn Place
- 1022 Gadwall Ln
- 1013 Gadwall Ln
- 1026 Gadwall Ln
- 1030 Gadwall Ln
- 1060 Harvey Springs Dr
- 2003 Fishers Loop
- 1746 Witt Way Dr
- 1742 Witt Way Dr
- 2004 Fishers Loop
- 1750 Witt Way Dr
- 1002 Fall Creek Ct
- 4005 Miles Johnson Pkwy
- 1738 Witt Way Dr
- 1754 Witt Way Dr
- 2002 Fishers Loop
- 1000 Fall Creek Ct
- 4007 Miles Johnson Pkwy
- 1808 Kara Ct
- 1758 Witt Way Dr
- 1804 Kara Ct
- 1745 Witt Way Dr
- 1800 Kara Ct
- 4009 Miles Johnson Pkwy
- 1749 Witt Way Dr
- 1003 Fall Creek Ct
Your Personal Tour Guide
Ask me questions while you tour the home.