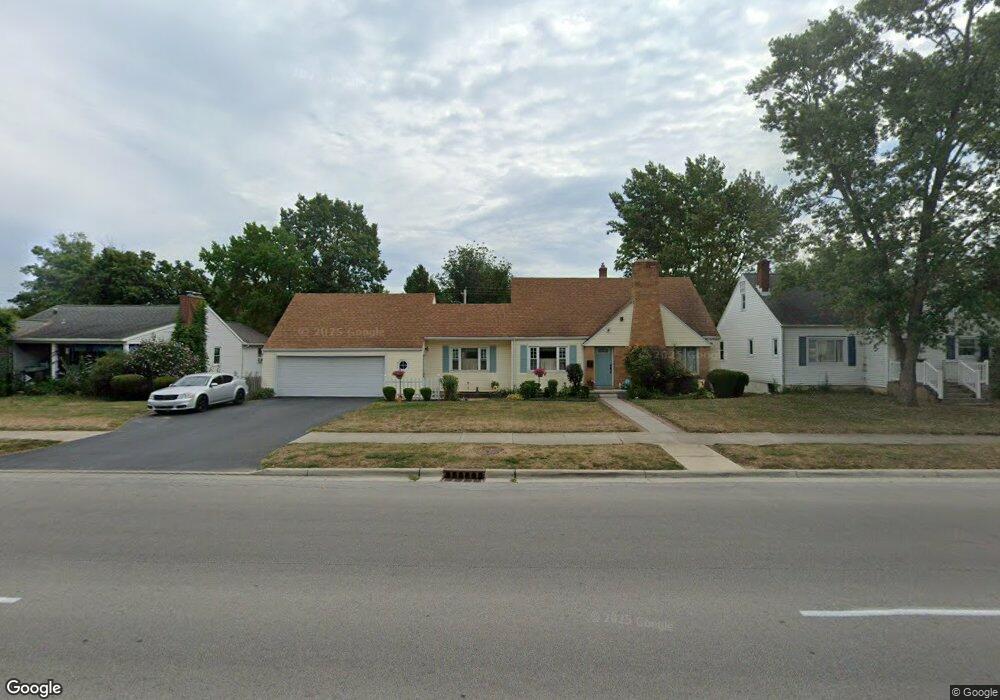
2005 N Main St Findlay, OH 45840
Estimated Value: $222,000 - $290,000
3
Beds
3
Baths
1,622
Sq Ft
$155/Sq Ft
Est. Value
About This Home
This home is located at 2005 N Main St, Findlay, OH 45840 and is currently estimated at $250,857, approximately $154 per square foot. 2005 N Main St is a home located in Hancock County with nearby schools including Northview Elementary School, Bigelow Hill Elementary School, and Glenwood Middle School.
Ownership History
Date
Name
Owned For
Owner Type
Purchase Details
Closed on
Sep 28, 2007
Sold by
Savieo Linda J and Curlis Linda J
Bought by
Romick Gary L and Romick Lisa K
Current Estimated Value
Home Financials for this Owner
Home Financials are based on the most recent Mortgage that was taken out on this home.
Original Mortgage
$144,000
Outstanding Balance
$91,493
Interest Rate
6.55%
Mortgage Type
Purchase Money Mortgage
Estimated Equity
$159,364
Purchase Details
Closed on
Jun 21, 1999
Sold by
Cook Shirlee
Bought by
Curlis Linda
Home Financials for this Owner
Home Financials are based on the most recent Mortgage that was taken out on this home.
Original Mortgage
$67,000
Interest Rate
7.06%
Mortgage Type
New Conventional
Purchase Details
Closed on
Dec 4, 1991
Bought by
Gephart Mark D
Purchase Details
Closed on
Aug 28, 1990
Bought by
Staschiak Sarah A
Purchase Details
Closed on
May 7, 1990
Bought by
Staschiak Realty Co
Purchase Details
Closed on
Aug 8, 1988
Bought by
Radcliff Gary L and Radcliff Jan R
Purchase Details
Closed on
May 27, 1986
Bought by
Ede Richard S and Ede Lori J
Create a Home Valuation Report for This Property
The Home Valuation Report is an in-depth analysis detailing your home's value as well as a comparison with similar homes in the area
Home Values in the Area
Average Home Value in this Area
Purchase History
| Date | Buyer | Sale Price | Title Company |
|---|---|---|---|
| Romick Gary L | $164,000 | Golden Key Title Agency | |
| Curlis Linda | $127,000 | -- | |
| Gephart Mark D | $110,000 | -- | |
| Staschiak Sarah A | $99,500 | -- | |
| Staschiak Realty Co | $75,000 | -- | |
| Radcliff Gary L | $86,900 | -- | |
| Ede Richard S | $72,000 | -- |
Source: Public Records
Mortgage History
| Date | Status | Borrower | Loan Amount |
|---|---|---|---|
| Open | Romick Gary L | $144,000 | |
| Closed | Curlis Linda | $67,000 |
Source: Public Records
Tax History Compared to Growth
Tax History
| Year | Tax Paid | Tax Assessment Tax Assessment Total Assessment is a certain percentage of the fair market value that is determined by local assessors to be the total taxable value of land and additions on the property. | Land | Improvement |
|---|---|---|---|---|
| 2024 | $2,261 | $63,650 | $8,090 | $55,560 |
| 2023 | $2,265 | $63,650 | $8,090 | $55,560 |
| 2022 | $2,257 | $63,650 | $8,090 | $55,560 |
| 2021 | $2,181 | $53,580 | $8,110 | $45,470 |
| 2020 | $2,181 | $53,580 | $8,110 | $45,470 |
| 2019 | $2,137 | $53,580 | $8,110 | $45,470 |
| 2018 | $2,025 | $46,590 | $7,050 | $39,540 |
| 2017 | $1,013 | $46,590 | $7,050 | $39,540 |
| 2016 | $1,859 | $43,320 | $7,050 | $36,270 |
| 2015 | $1,849 | $42,290 | $6,490 | $35,800 |
| 2014 | $1,849 | $42,290 | $6,490 | $35,800 |
| 2012 | $1,862 | $42,290 | $6,490 | $35,800 |
Source: Public Records
Map
Nearby Homes
- 2100 Candlewick Dr
- 1934 Geffs Ave
- 1820 N Main St
- 1825 Pershing St
- 304 Prentiss Ave
- 231 Tioga Ave
- 304 Rector Ave
- 128 Harrington Ave
- 405 Clifton Ave
- 410 Monroe Ave
- 600 Charles Ave
- 1908 Gayle Ln
- 334 E Foulke Ave
- 643 Edith Ave
- 206 Midland Ave
- 230 Midland Ave
- 420 Allen Ave
- 715 Christina Ct
- 126 Hillcrest Ave
- 0 E Melrose Ave