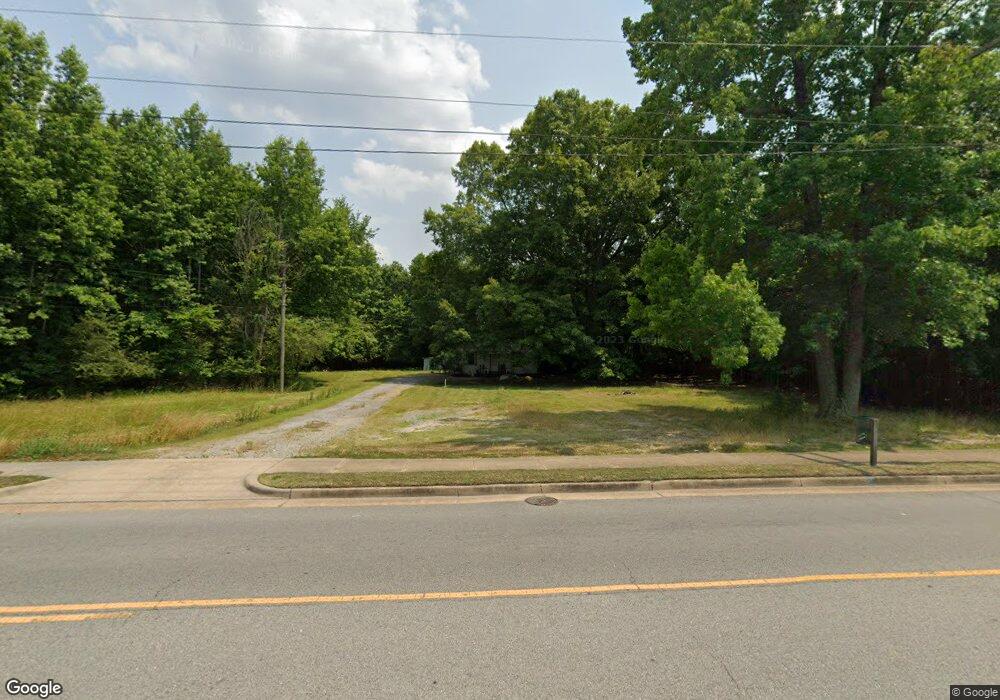
2005 South St Franklin, VA 23851
Estimated Value: $171,000 - $334,531
2
Beds
1
Bath
900
Sq Ft
$243/Sq Ft
Est. Value
About This Home
This home is located at 2005 South St, Franklin, VA 23851 and is currently estimated at $218,633, approximately $242 per square foot. 2005 South St is a home located in Franklin City with nearby schools including S.P. Morton Elementary School, Joseph P. King Jr. Middle School, and Franklin High School.
Ownership History
Date
Name
Owned For
Owner Type
Purchase Details
Closed on
Mar 11, 2009
Sold by
Federal Natl Mtg Asson
Bought by
Brinkley Marcus C
Current Estimated Value
Home Financials for this Owner
Home Financials are based on the most recent Mortgage that was taken out on this home.
Original Mortgage
$152,625
Outstanding Balance
$96,890
Interest Rate
5.18%
Mortgage Type
FHA
Estimated Equity
$121,743
Purchase Details
Closed on
Aug 22, 2008
Sold by
Professional Foreclosure Corp
Bought by
Federal National Mortgage Association
Purchase Details
Closed on
May 23, 2007
Sold by
American Timberland Co
Bought by
Kingery Steven W
Home Financials for this Owner
Home Financials are based on the most recent Mortgage that was taken out on this home.
Original Mortgage
$189,905
Interest Rate
6.27%
Mortgage Type
New Conventional
Purchase Details
Closed on
Aug 23, 2005
Sold by
Frye Gary E
Bought by
American Timberland Company
Create a Home Valuation Report for This Property
The Home Valuation Report is an in-depth analysis detailing your home's value as well as a comparison with similar homes in the area
Home Values in the Area
Average Home Value in this Area
Purchase History
| Date | Buyer | Sale Price | Title Company |
|---|---|---|---|
| Brinkley Marcus C | $160,000 | -- | |
| Federal National Mortgage Association | $198,000 | -- | |
| Kingery Steven W | $199,900 | -- | |
| American Timberland Company | $80,000 | -- |
Source: Public Records
Mortgage History
| Date | Status | Borrower | Loan Amount |
|---|---|---|---|
| Open | American Timberland Company | $152,625 | |
| Previous Owner | American Timberland Company | $189,905 |
Source: Public Records
Tax History
| Year | Tax Paid | Tax Assessment Tax Assessment Total Assessment is a certain percentage of the fair market value that is determined by local assessors to be the total taxable value of land and additions on the property. | Land | Improvement |
|---|---|---|---|---|
| 2025 | $662 | $64,300 | $44,300 | $20,000 |
| 2024 | $331 | $64,300 | $44,300 | $20,000 |
| 2023 | $546 | $53,000 | $39,200 | $13,800 |
| 2022 | $546 | $53,000 | $39,200 | $13,800 |
| 2021 | $476 | $46,200 | $35,600 | $10,600 |
| 2020 | $463 | $46,200 | $35,600 | $10,600 |
| 2019 | $463 | $46,800 | $35,600 | $11,200 |
| 2018 | $463 | $46,800 | $35,600 | $11,200 |
| 2017 | $845 | $85,400 | $69,800 | $15,600 |
| 2016 | $845 | $85,400 | $69,800 | $15,600 |
| 2015 | -- | $0 | $0 | $0 |
| 2014 | -- | $0 | $0 | $0 |
| 2013 | -- | $0 | $0 | $0 |
Source: Public Records
Map
Nearby Homes
Your Personal Tour Guide
Ask me questions while you tour the home.