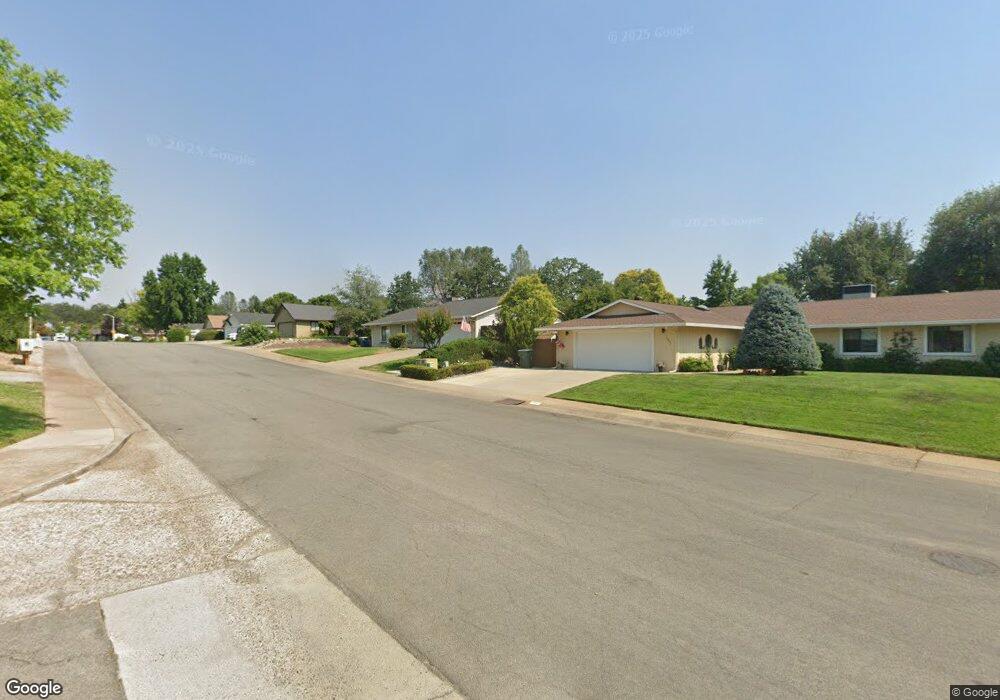
2005 Tiburon Dr Redding, CA 96003
Lema Ranch NeighborhoodEstimated Value: $393,000 - $424,371
3
Beds
2
Baths
1,448
Sq Ft
$283/Sq Ft
Est. Value
About This Home
This home is located at 2005 Tiburon Dr, Redding, CA 96003 and is currently estimated at $409,593, approximately $282 per square foot. 2005 Tiburon Dr is a home located in Shasta County with nearby schools including Columbia Elementary School, Mountain View Middle School, and Foothill High School.
Ownership History
Date
Name
Owned For
Owner Type
Purchase Details
Closed on
Jun 3, 2024
Sold by
Linn Scott P and Linn Patricia R
Bought by
Paul Justin and Paul Megan
Current Estimated Value
Home Financials for this Owner
Home Financials are based on the most recent Mortgage that was taken out on this home.
Original Mortgage
$414,675
Outstanding Balance
$407,994
Interest Rate
7.1%
Mortgage Type
New Conventional
Estimated Equity
$1,599
Purchase Details
Closed on
May 25, 1999
Sold by
Eichor Robert J
Bought by
Linn Scott P and Linn Patricia R
Home Financials for this Owner
Home Financials are based on the most recent Mortgage that was taken out on this home.
Original Mortgage
$114,823
Interest Rate
6.9%
Mortgage Type
FHA
Purchase Details
Closed on
May 11, 1998
Sold by
Eichor Robert J
Bought by
Eichor Robert J
Create a Home Valuation Report for This Property
The Home Valuation Report is an in-depth analysis detailing your home's value as well as a comparison with similar homes in the area
Home Values in the Area
Average Home Value in this Area
Purchase History
| Date | Buyer | Sale Price | Title Company |
|---|---|---|---|
| Paul Justin | $427,500 | Placer Title | |
| Linn Scott P | $115,000 | First American Title Co | |
| Eichor Robert J | -- | -- |
Source: Public Records
Mortgage History
| Date | Status | Borrower | Loan Amount |
|---|---|---|---|
| Open | Paul Justin | $414,675 | |
| Previous Owner | Linn Scott P | $114,823 | |
| Closed | Linn Scott P | $5,750 |
Source: Public Records
Tax History
| Year | Tax Paid | Tax Assessment Tax Assessment Total Assessment is a certain percentage of the fair market value that is determined by local assessors to be the total taxable value of land and additions on the property. | Land | Improvement |
|---|---|---|---|---|
| 2025 | $2,350 | $436,050 | $66,300 | $369,750 |
| 2024 | $2,357 | $207,751 | $38,412 | $169,339 |
| 2023 | $2,357 | $203,678 | $37,659 | $166,019 |
| 2022 | $2,273 | $199,685 | $36,921 | $162,764 |
| 2021 | $2,262 | $195,771 | $36,198 | $159,573 |
| 2020 | $2,246 | $193,764 | $35,827 | $157,937 |
| 2019 | $2,195 | $189,966 | $35,125 | $154,841 |
| 2018 | $2,207 | $186,242 | $34,437 | $151,805 |
| 2017 | $2,153 | $182,591 | $33,762 | $148,829 |
| 2016 | $2,017 | $179,011 | $33,100 | $145,911 |
| 2015 | $1,984 | $176,323 | $32,603 | $143,720 |
| 2014 | $1,930 | $172,870 | $31,965 | $140,905 |
Source: Public Records
Map
Nearby Homes
- 965 Willow Brook Ln
- 1090 Gibralter Rd
- 1110 Grouse Dr
- 1285 Lancers Ln
- 1088 Burton Dr
- 2182 Cadjew St
- 550 Armando Ave
- 1230 Whistling Dr
- 547 Casa Buena St
- 667 Reddington Dr
- 1637 French Lace Ln
- 1939 Cameo Ct
- 332 Franciscan Trail
- 790 Volcano View Trail
- 2093 Victor Ave
- 771 Flower Ash Ln
- 2199 Princeton Way
- 825 Mission Sierra Ct
- 10033 Abernathy Ln
- 856 Mission de Oro Dr
- 2023 Tiburon Dr
- 1997 Tiburon Dr
- 1039 Oakmont Dr
- 2049 Tiburon Dr
- 1027 Oakmont Dr
- 2010 Tiburon Dr
- 1991 Tiburon Dr
- 994 Willow Brook Ln
- 1014 Peregrine Way
- 1036 Peregrine Way
- 1047 Oakmont Dr
- 2065 Tiburon Dr
- 998 Oakmont Dr
- 1396 Minder Dr
- 1985 Tiburon Dr
- 1990 Tiburon Dr
- 986 Willow Brook Ln Unit 1
- 986 Willow Brook Ln
- 1051 Oakmont Dr
- 1038 Red Tail Dr
Your Personal Tour Guide
Ask me questions while you tour the home.