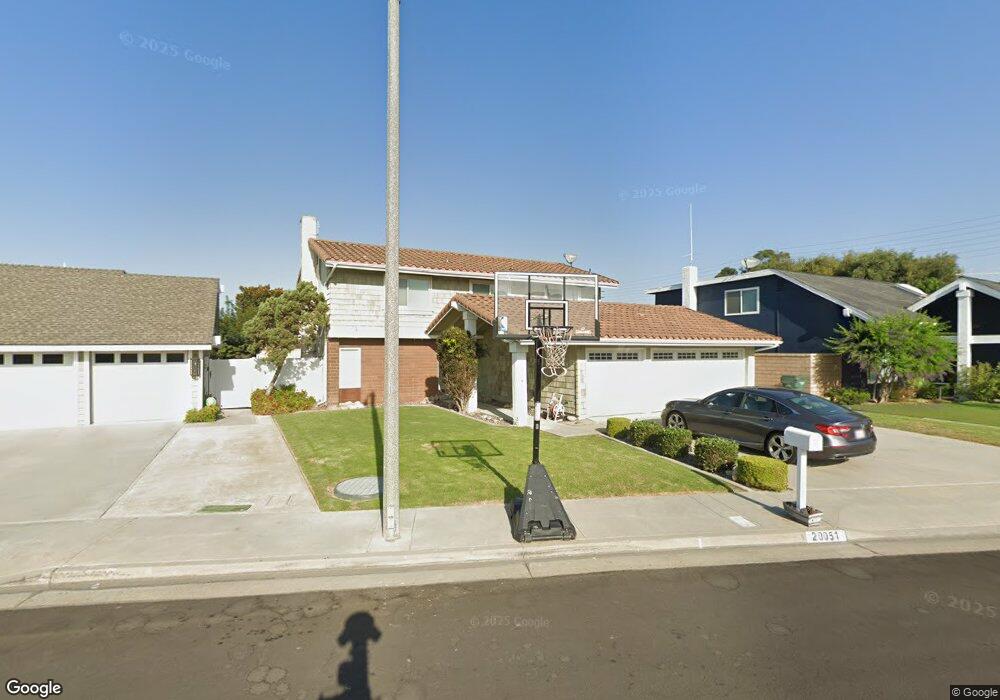
20051 Gothic Cir Huntington Beach, CA 92646
Southeast NeighborhoodEstimated Value: $1,447,296 - $1,615,000
4
Beds
3
Baths
1,698
Sq Ft
$899/Sq Ft
Est. Value
About This Home
This home is located at 20051 Gothic Cir, Huntington Beach, CA 92646 and is currently estimated at $1,526,824, approximately $899 per square foot. 20051 Gothic Cir is a home located in Orange County with nearby schools including S.A. Moffett Elementary School, Isaac L. Sowers Middle School, and Edison High School.
Ownership History
Date
Name
Owned For
Owner Type
Purchase Details
Closed on
Sep 17, 2012
Sold by
Min John
Bought by
Min John and Kim Min Gloria Su Min
Current Estimated Value
Home Financials for this Owner
Home Financials are based on the most recent Mortgage that was taken out on this home.
Original Mortgage
$402,000
Outstanding Balance
$277,905
Interest Rate
3.55%
Mortgage Type
New Conventional
Estimated Equity
$1,248,919
Purchase Details
Closed on
Dec 4, 2000
Sold by
Min Byung T and Min Young H
Bought by
Min John
Home Financials for this Owner
Home Financials are based on the most recent Mortgage that was taken out on this home.
Original Mortgage
$231,000
Interest Rate
7.41%
Purchase Details
Closed on
Jul 15, 1999
Sold by
Security Trust Company
Bought by
Min John and Min Byung T
Purchase Details
Closed on
Jul 24, 1996
Sold by
Min Byung T and Min Young H
Bought by
Min John and Min Byung T
Home Financials for this Owner
Home Financials are based on the most recent Mortgage that was taken out on this home.
Original Mortgage
$187,000
Interest Rate
6.85%
Create a Home Valuation Report for This Property
The Home Valuation Report is an in-depth analysis detailing your home's value as well as a comparison with similar homes in the area
Home Values in the Area
Average Home Value in this Area
Purchase History
| Date | Buyer | Sale Price | Title Company |
|---|---|---|---|
| Min John | -- | None Available | |
| Min John | -- | Fidelity National Title Ins | |
| Min John | -- | Chicago Title Co | |
| Min John | -- | California Counties Title Co |
Source: Public Records
Mortgage History
| Date | Status | Borrower | Loan Amount |
|---|---|---|---|
| Open | Min John | $402,000 | |
| Closed | Min John | $231,000 | |
| Previous Owner | Min John | $187,000 |
Source: Public Records
Tax History Compared to Growth
Tax History
| Year | Tax Paid | Tax Assessment Tax Assessment Total Assessment is a certain percentage of the fair market value that is determined by local assessors to be the total taxable value of land and additions on the property. | Land | Improvement |
|---|---|---|---|---|
| 2025 | $4,996 | $433,041 | $251,761 | $181,280 |
| 2024 | $4,996 | $424,550 | $246,824 | $177,726 |
| 2023 | $4,881 | $416,226 | $241,984 | $174,242 |
| 2022 | $4,751 | $408,065 | $237,239 | $170,826 |
| 2021 | $4,662 | $400,064 | $232,587 | $167,477 |
| 2020 | $4,631 | $395,962 | $230,202 | $165,760 |
| 2019 | $4,576 | $388,199 | $225,689 | $162,510 |
| 2018 | $4,505 | $380,588 | $221,264 | $159,324 |
| 2017 | $4,444 | $373,126 | $216,926 | $156,200 |
| 2016 | $4,191 | $360,377 | $212,672 | $147,705 |
| 2015 | $4,149 | $354,964 | $209,477 | $145,487 |
| 2014 | $4,061 | $348,011 | $205,373 | $142,638 |
Source: Public Records
Map
Nearby Homes
- 20131 Crown Reef Ln
- 20258 Lantana Dr
- 20191 Imperial Cove Ln
- 20111 Marina Ln
- 9121 Madeline Dr
- 8472 Norfolk Dr
- 20071 Moontide Cir
- 20251 Lighthouse Ln
- 8886 Plumas Cir Unit 1124-A
- 9172 Veronica Dr
- 8582 Salt Lake Dr
- 20162 S New Britain Ln
- 8565 Trinity Cir Unit 824D
- 8856 Sutter Cir Unit 522A
- 8342 Seaport Dr
- 8932 Amador Cir Unit 1309B
- 8646 Butte Cir Unit 607E
- 8856 526C Sutter
- 9522 Yellowstone Dr
- 8565 Colusa Cir Unit 906C
- 20031 Gothic Cir
- 20061 Gothic Cir
- 20052 Mural Cir
- 20032 Mural Cir
- 20071 Gothic Cir
- 20011 Gothic Cir
- 20062 Mural Cir
- 20062 Gothic Cir
- 20012 Mural Cir
- 20052 Gothic Cir
- 20072 Gothic Cir
- 20081 Gothic Cir
- 20032 Gothic Cir
- 20082 Gothic Cir
- 20082 Mural Cir
- 20071 Swansea Ln
- 20061 Swansea Ln
- 20012 Gothic Cir
- 8881 Bellshire Dr
- 20051 Mural Cir