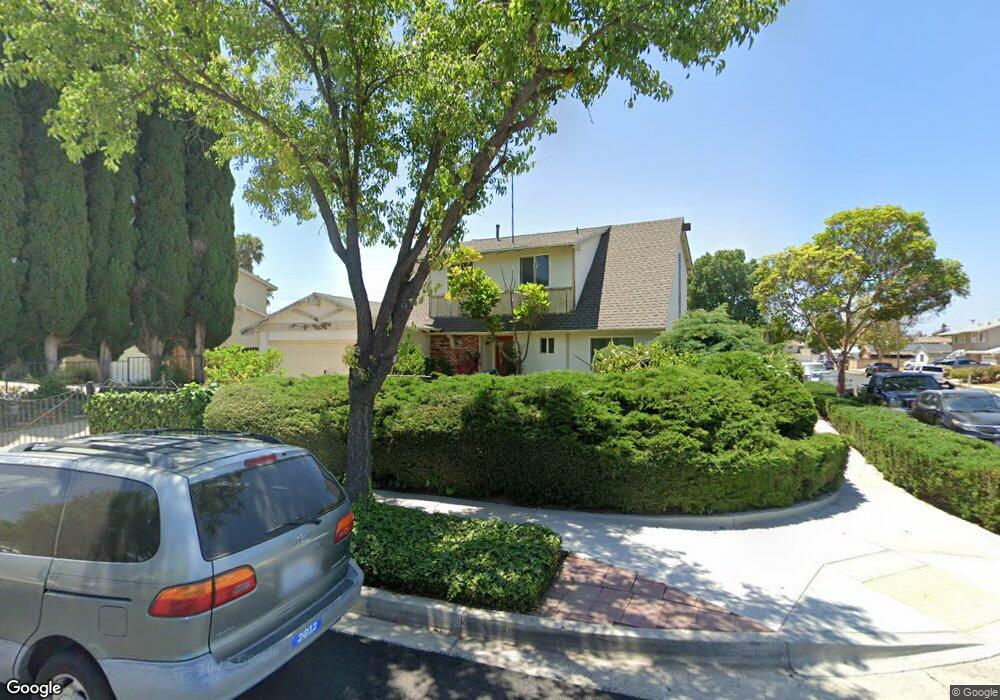
2006 Rhoda St Simi Valley, CA 93065
Central Simi Valley NeighborhoodEstimated Value: $729,816 - $795,000
4
Beds
2
Baths
1,580
Sq Ft
$490/Sq Ft
Est. Value
About This Home
This home is located at 2006 Rhoda St, Simi Valley, CA 93065 and is currently estimated at $774,204, approximately $490 per square foot. 2006 Rhoda St is a home located in Ventura County with nearby schools including Berylwood Elementary School, Hillside Middle School, and Royal High School.
Ownership History
Date
Name
Owned For
Owner Type
Purchase Details
Closed on
Sep 8, 2006
Sold by
Zapata Eduardo and Zapata Rosa
Bought by
Zapata Eduardo B and Zapata Rosa M
Current Estimated Value
Purchase Details
Closed on
Jul 7, 1999
Sold by
Helen Steinhardt
Bought by
Zapata Eduardo and Zapata Rosa
Home Financials for this Owner
Home Financials are based on the most recent Mortgage that was taken out on this home.
Original Mortgage
$179,900
Outstanding Balance
$50,710
Interest Rate
7.64%
Estimated Equity
$723,494
Purchase Details
Closed on
May 12, 1999
Sold by
Helen Steinhardt
Bought by
Steinhardt Helen E
Home Financials for this Owner
Home Financials are based on the most recent Mortgage that was taken out on this home.
Original Mortgage
$179,900
Outstanding Balance
$50,710
Interest Rate
7.64%
Estimated Equity
$723,494
Create a Home Valuation Report for This Property
The Home Valuation Report is an in-depth analysis detailing your home's value as well as a comparison with similar homes in the area
Home Values in the Area
Average Home Value in this Area
Purchase History
| Date | Buyer | Sale Price | Title Company |
|---|---|---|---|
| Zapata Eduardo B | -- | None Available | |
| Zapata Eduardo | $200,000 | -- | |
| Steinhardt Helen E | -- | -- |
Source: Public Records
Mortgage History
| Date | Status | Borrower | Loan Amount |
|---|---|---|---|
| Open | Zapata Eduardo | $179,900 |
Source: Public Records
Tax History
| Year | Tax Paid | Tax Assessment Tax Assessment Total Assessment is a certain percentage of the fair market value that is determined by local assessors to be the total taxable value of land and additions on the property. | Land | Improvement |
|---|---|---|---|---|
| 2025 | $4,014 | $307,285 | $122,912 | $184,373 |
| 2024 | $4,014 | $301,260 | $120,502 | $180,758 |
| 2023 | $3,771 | $295,353 | $118,139 | $177,214 |
| 2022 | $3,737 | $289,562 | $115,822 | $173,740 |
| 2021 | $3,694 | $283,885 | $113,551 | $170,334 |
| 2020 | $3,606 | $280,977 | $112,388 | $168,589 |
| 2019 | $3,439 | $275,469 | $110,185 | $165,284 |
| 2018 | $3,398 | $270,069 | $108,025 | $162,044 |
| 2017 | $3,314 | $264,774 | $105,907 | $158,867 |
| 2016 | $3,161 | $259,583 | $103,831 | $155,752 |
| 2015 | $3,085 | $255,685 | $102,272 | $153,413 |
| 2014 | $3,031 | $250,679 | $100,270 | $150,409 |
Source: Public Records
Map
Nearby Homes
- 2002 Malcolm St
- 1904 Heywood St Unit L
- 2165 Malcolm St
- 1932 Heywood St Unit B
- 2025 Royal Ave
- 1387 Cherry Ave
- 1755 Heywood St
- 1763 Kearney Ave
- 1805 Hillary Ct
- 2091 Marter Ave
- 2399 Lee St
- 2405 Lee St
- 1843 Garvin Ave
- 1954 Claudia Ave
- 2239 McDonald St
- 1147 Brandon Ave
- 2136 Rosecrans St
- 2371 Larch St
- 2311 Marvel Ave
- 1890 Hamilton St
- 2018 Rhoda St
- 2003 Malcolm St
- 2011 Malcolm St
- 2030 Rhoda St
- 2059 Abraham St
- 2007 Rhoda Adu St
- 2065 Abraham St
- 2007 Rhoda St
- 2047 Abraham St
- 2025 Malcolm St
- 2077 Abraham St
- 2042 Rhoda St
- 2023 Rhoda St
- 2035 Abraham St
- 2031 Malcolm St
- 2054 Rhoda St
- 2089 Abraham St
- 2048 Heywood St
- 2029 Abraham St
- 2094 Abraham St
Your Personal Tour Guide
Ask me questions while you tour the home.