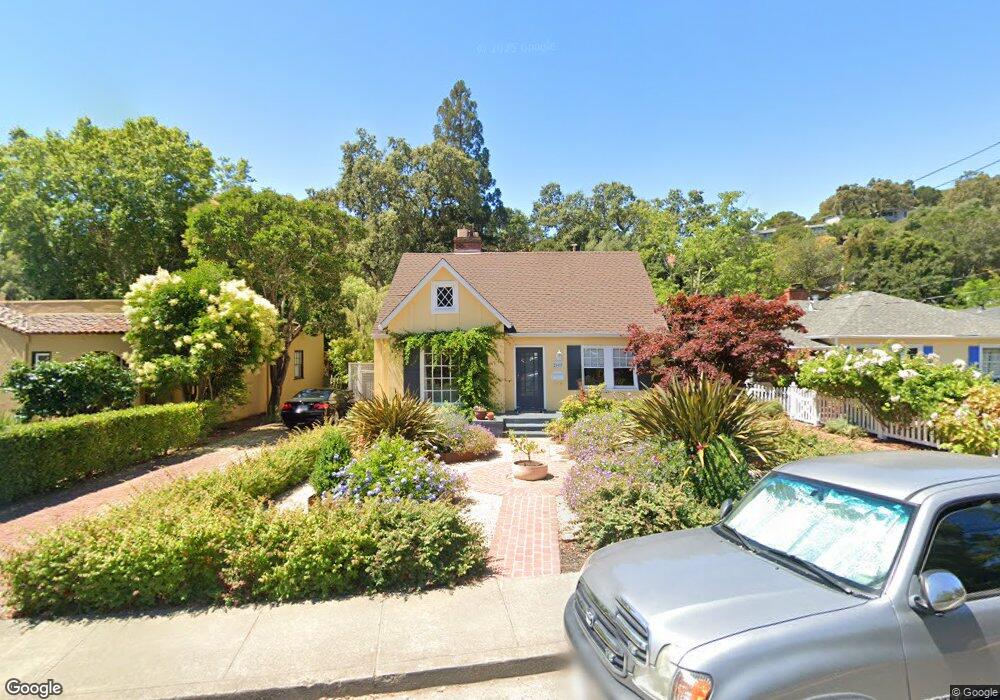
2007 5th Ave San Rafael, CA 94901
Sun Valley NeighborhoodEstimated Value: $1,079,740 - $1,298,000
2
Beds
1
Bath
969
Sq Ft
$1,216/Sq Ft
Est. Value
About This Home
This home is located at 2007 5th Ave, San Rafael, CA 94901 and is currently estimated at $1,177,935, approximately $1,215 per square foot. 2007 5th Ave is a home located in Marin County with nearby schools including Sun Valley Elementary School, James B. Davidson Middle School, and San Rafael High School.
Ownership History
Date
Name
Owned For
Owner Type
Purchase Details
Closed on
Jun 11, 2013
Sold by
Fitzgerald Margaret Rose and Webb Raymond C
Bought by
Fitzgerald Margaret Rose and Webb Raymond C
Current Estimated Value
Purchase Details
Closed on
Sep 13, 2002
Sold by
Spradling Linda
Bought by
Webb Raymond and Fitzgerald Margaret
Home Financials for this Owner
Home Financials are based on the most recent Mortgage that was taken out on this home.
Original Mortgage
$500,000
Outstanding Balance
$208,867
Interest Rate
6.24%
Estimated Equity
$969,068
Purchase Details
Closed on
Dec 17, 1996
Sold by
Hennigar Mary Jo
Bought by
Spradling Linda J
Home Financials for this Owner
Home Financials are based on the most recent Mortgage that was taken out on this home.
Original Mortgage
$220,000
Interest Rate
6.82%
Create a Home Valuation Report for This Property
The Home Valuation Report is an in-depth analysis detailing your home's value as well as a comparison with similar homes in the area
Home Values in the Area
Average Home Value in this Area
Purchase History
| Date | Buyer | Sale Price | Title Company |
|---|---|---|---|
| Fitzgerald Margaret Rose | -- | None Available | |
| Webb Raymond | $625,000 | First American Title Company | |
| Spradling Linda J | $275,784 | First American Title Co |
Source: Public Records
Mortgage History
| Date | Status | Borrower | Loan Amount |
|---|---|---|---|
| Open | Webb Raymond | $500,000 | |
| Previous Owner | Spradling Linda J | $220,000 | |
| Closed | Webb Raymond | $40,500 |
Source: Public Records
Tax History Compared to Growth
Tax History
| Year | Tax Paid | Tax Assessment Tax Assessment Total Assessment is a certain percentage of the fair market value that is determined by local assessors to be the total taxable value of land and additions on the property. | Land | Improvement |
|---|---|---|---|---|
| 2025 | $12,617 | $905,125 | $579,280 | $325,845 |
| 2024 | $12,617 | $887,381 | $567,924 | $319,457 |
| 2023 | $12,390 | $869,987 | $556,792 | $313,195 |
| 2022 | $11,717 | $852,931 | $545,876 | $307,055 |
| 2021 | $11,531 | $836,212 | $535,176 | $301,036 |
| 2020 | $11,410 | $827,643 | $529,692 | $297,951 |
| 2019 | $11,085 | $811,418 | $519,308 | $292,110 |
| 2018 | $10,973 | $795,512 | $509,128 | $286,384 |
| 2017 | $10,558 | $779,918 | $499,148 | $280,770 |
| 2016 | $10,204 | $764,631 | $489,364 | $275,267 |
| 2015 | $9,751 | $753,150 | $482,016 | $271,134 |
| 2014 | $9,348 | $738,400 | $472,576 | $265,824 |
Source: Public Records
Map
Nearby Homes