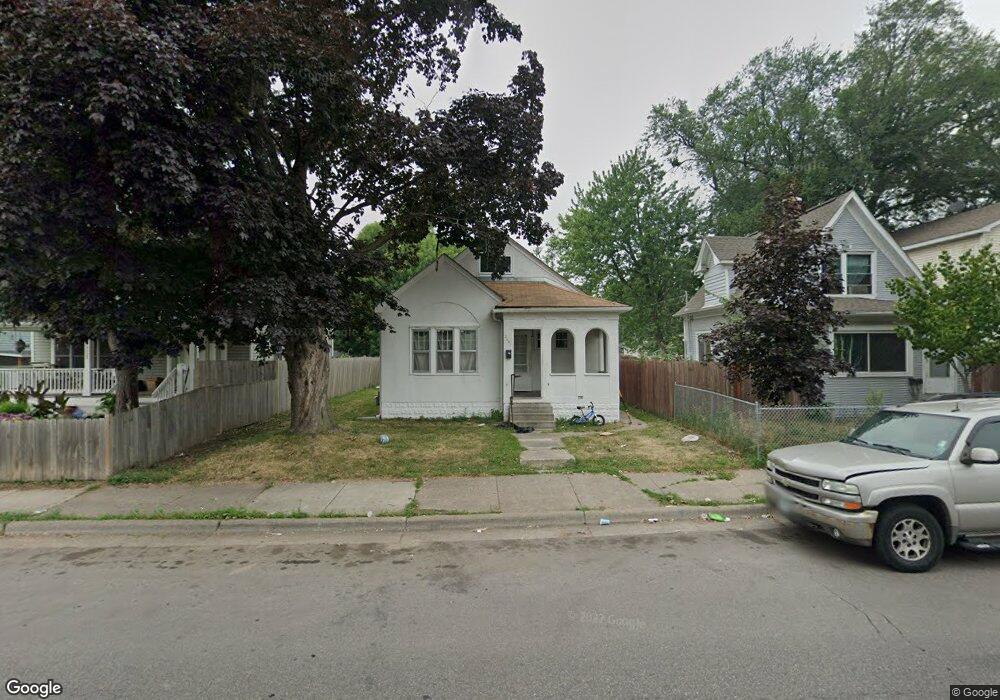
2007 Penn Ave N Minneapolis, MN 55411
Willard-Hay NeighborhoodEstimated Value: $167,000 - $266,000
3
Beds
1
Bath
1,064
Sq Ft
$189/Sq Ft
Est. Value
About This Home
This home is located at 2007 Penn Ave N, Minneapolis, MN 55411 and is currently estimated at $201,485, approximately $189 per square foot. 2007 Penn Ave N is a home located in Hennepin County with nearby schools including Bryn Mawr Elementary School, Anwatin Middle School, and North High School.
Ownership History
Date
Name
Owned For
Owner Type
Purchase Details
Closed on
Aug 15, 2008
Sold by
Citimortgage Inc
Bought by
Zeman Robert
Current Estimated Value
Purchase Details
Closed on
Mar 21, 2007
Sold by
Montgomery Praff G
Bought by
Marshall Isaac
Purchase Details
Closed on
May 30, 2000
Sold by
Wmc Mtg Corp
Bought by
Montgomery Pratt G
Purchase Details
Closed on
Feb 23, 1998
Sold by
Salem Inc
Bought by
Michaud Bridget
Purchase Details
Closed on
Nov 18, 1997
Sold by
Conti Mtg Corp
Bought by
Salem Inc
Purchase Details
Closed on
Feb 21, 1996
Sold by
Hamilton Vajour
Bought by
Perry Willie
Purchase Details
Closed on
Feb 1, 1996
Sold by
Cheney Veronique
Bought by
Hamilton Vajour
Create a Home Valuation Report for This Property
The Home Valuation Report is an in-depth analysis detailing your home's value as well as a comparison with similar homes in the area
Home Values in the Area
Average Home Value in this Area
Purchase History
| Date | Buyer | Sale Price | Title Company |
|---|---|---|---|
| Zeman Robert | $12,500 | -- | |
| Marshall Isaac | $205,000 | -- | |
| Montgomery Pratt G | $48,000 | -- | |
| Michaud Bridget | $75,000 | -- | |
| Salem Inc | $17,000 | -- | |
| Perry Willie | $54,000 | -- | |
| Hamilton Vajour | $28,000 | -- |
Source: Public Records
Tax History Compared to Growth
Tax History
| Year | Tax Paid | Tax Assessment Tax Assessment Total Assessment is a certain percentage of the fair market value that is determined by local assessors to be the total taxable value of land and additions on the property. | Land | Improvement |
|---|---|---|---|---|
| 2024 | $1,554 | $105,000 | $14,000 | $91,000 |
| 2023 | $3,124 | $106,000 | $14,000 | $92,000 |
| 2022 | $1,707 | $98,000 | $14,000 | $84,000 |
| 2021 | $1,106 | $86,000 | $8,000 | $78,000 |
| 2020 | $1,089 | $83,000 | $10,800 | $72,200 |
| 2019 | $1,018 | $75,500 | $7,200 | $68,300 |
| 2018 | $971 | $68,500 | $7,200 | $61,300 |
| 2017 | $994 | $65,000 | $6,500 | $58,500 |
| 2016 | $1,081 | $68,500 | $6,500 | $62,000 |
| 2015 | $1,034 | $62,500 | $6,500 | $56,000 |
| 2014 | -- | $55,500 | $6,500 | $49,000 |
Source: Public Records
Map
Nearby Homes
- 2007 Queen Ave N
- 2119 Oliver Ave N
- 1942 Oliver Ave N
- 2114 Sheridan Ave N
- 2123 Sheridan Ave N
- 1722 Queen Ave N
- 1800 Penn Ave N
- 2304 N Sheridan Ave
- 2349 Ferrant Place
- 2604 Golden Valley Rd
- 2029 Willow Ave N
- 2316 24th Ave N
- 2113 Ilion Ave N
- 1933 Hillside Ave N
- 1815 Hillside Ave N
- 1642 Thomas Ave N
- 1910 24th Ave N
- 2046 James Ave N
- 2024 25th Ave N
- 1530 Penn Ave N
- 2011 Penn Ave N
- 2003 Penn Ave N
- 2015 Penn Ave N
- 1927 Penn Ave N
- 2019 Penn Ave N
- 1921 Penn Ave N
- 2006 Queen Ave N
- 2002 Queen Ave N
- 2010 Queen Ave N
- 2021 Penn Ave N
- 1919 Penn Ave N
- 1926 Queen Ave N
- 2014 Queen Ave N
- 1922 Queen Ave N
- 2018 Queen Ave N
- 1926 Penn Ave N
- 2006 Penn Ave N
- 2025 Penn Ave N
- 1915 Penn Ave N
- 1922 Penn Ave N