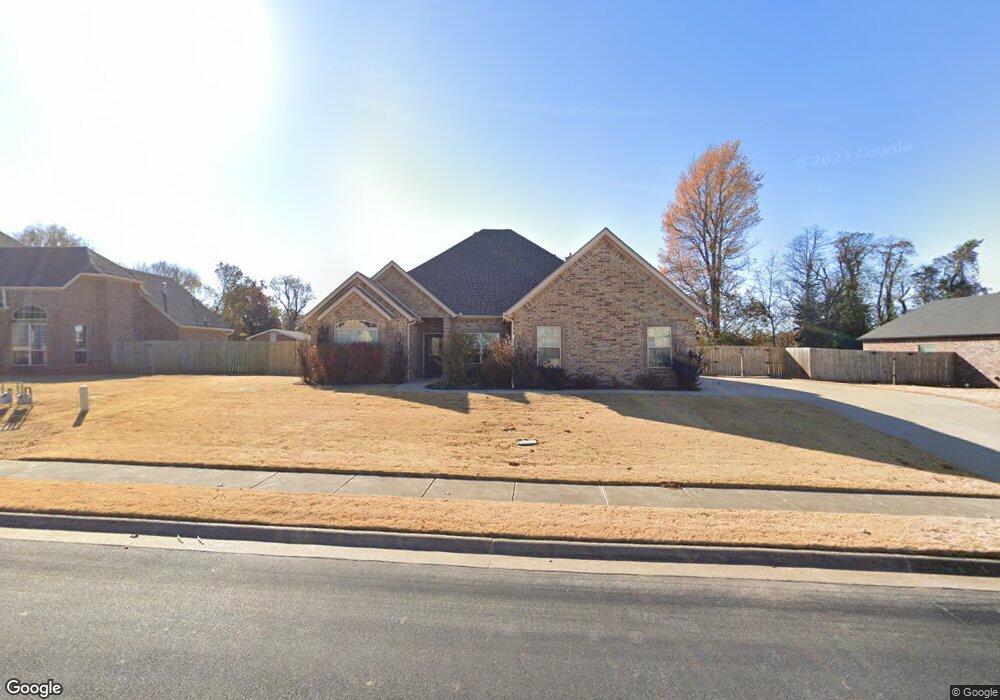
2007 Sicily Ave Lowell, AR 72745
Estimated Value: $455,221 - $583,000
4
Beds
2
Baths
2,123
Sq Ft
$236/Sq Ft
Est. Value
About This Home
This home is located at 2007 Sicily Ave, Lowell, AR 72745 and is currently estimated at $500,805, approximately $235 per square foot. 2007 Sicily Ave is a home located in Benton County with nearby schools including Fairview Elementary School, Elmwood Middle School, and Rogers High School.
Ownership History
Date
Name
Owned For
Owner Type
Purchase Details
Closed on
Mar 30, 2010
Sold by
Dts Brokerage & Development Llc
Bought by
Staggs John E and Staggs Shelby K
Current Estimated Value
Home Financials for this Owner
Home Financials are based on the most recent Mortgage that was taken out on this home.
Original Mortgage
$211,105
Outstanding Balance
$137,745
Interest Rate
4.75%
Mortgage Type
FHA
Estimated Equity
$363,060
Purchase Details
Closed on
Jul 29, 2009
Sold by
First Federal Bank
Bought by
Dts Brokerage & Development Llc
Home Financials for this Owner
Home Financials are based on the most recent Mortgage that was taken out on this home.
Original Mortgage
$168,800
Interest Rate
5.31%
Mortgage Type
Construction
Purchase Details
Closed on
Dec 10, 2004
Bought by
Nwa Inv 39 and Nwa 07Ac
Create a Home Valuation Report for This Property
The Home Valuation Report is an in-depth analysis detailing your home's value as well as a comparison with similar homes in the area
Home Values in the Area
Average Home Value in this Area
Purchase History
| Date | Buyer | Sale Price | Title Company |
|---|---|---|---|
| Staggs John E | $215,000 | Kings River Title | |
| Dts Brokerage & Development Llc | $200,000 | Landtrust Title & Closing In | |
| Nwa Inv 39 | $1,950,000 | -- |
Source: Public Records
Mortgage History
| Date | Status | Borrower | Loan Amount |
|---|---|---|---|
| Open | Staggs John E | $211,105 | |
| Previous Owner | Dts Brokerage & Development Llc | $168,800 |
Source: Public Records
Tax History
| Year | Tax Paid | Tax Assessment Tax Assessment Total Assessment is a certain percentage of the fair market value that is determined by local assessors to be the total taxable value of land and additions on the property. | Land | Improvement |
|---|---|---|---|---|
| 2025 | $3,458 | $79,363 | $15,200 | $64,163 |
| 2024 | $3,065 | $79,363 | $15,200 | $64,163 |
| 2023 | $2,761 | $51,900 | $7,200 | $44,700 |
| 2022 | $2,646 | $51,900 | $7,200 | $44,700 |
| 2021 | $2,639 | $51,900 | $7,200 | $44,700 |
| 2020 | $2,618 | $51,420 | $7,200 | $44,220 |
| 2019 | $2,541 | $51,420 | $7,200 | $44,220 |
| 2018 | $2,462 | $51,420 | $7,200 | $44,220 |
| 2017 | $2,058 | $51,420 | $7,200 | $44,220 |
| 2016 | $2,058 | $51,420 | $7,200 | $44,220 |
| 2015 | $2,293 | $43,110 | $5,400 | $37,710 |
| 2014 | $1,943 | $43,110 | $5,400 | $37,710 |
Source: Public Records
Map
Nearby Homes
- 423 Ladelle Ave
- 2014 Price Ave
- 302 Spring Creek Rd
- 208 Cowans St
- 117 Colville St
- 203 Colville St
- 216 Ford St
- 1901 Quinlan Ave
- 2202 Elmwood Ave
- 2303 Elmwood Ave
- 1705 Billie Acres Place
- 2308 Hickory Wood Ave
- 2403 Hickory Wood Ave
- 202 Woodland St
- 507 Ashwood St
- 626 Woodcreek Loop
- 4813 Willowridge Way
- 1503 Pack Cove
- 4123 Willowbend Dr
- 541 Woodcreek Loop
- 2003 Sicily Ave
- 2011 Sicily Ave
- 2015 Sicily Ave
- 2004 Sicily Ave
- 2008 Sicily Ave
- 2000 Sicily Ave
- 2012 Sicily Ave
- 1925 Sicily Ave
- 1924 Sicily Ave
- 2019 Sicily Ave
- 2016 Sicily Ave
- 2004 Ladelle Ave
- 1919 Sicily Ave
- 2003 Florence Ave
- 2007 Florence Ave
- 2001 Florence Ave
- 1920 Sicily Ave
- 2011 Florence Ave
- 1923 Florence Ave
- 220 Tuscan St
Your Personal Tour Guide
Ask me questions while you tour the home.