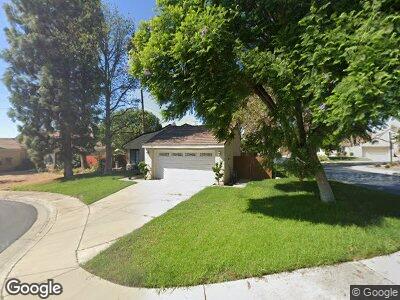
2007 Springcreek Cir Upland, CA 91784
Estimated Value: $679,764 - $704,000
2
Beds
2
Baths
1,120
Sq Ft
$620/Sq Ft
Est. Value
About This Home
This home is located at 2007 Springcreek Cir, Upland, CA 91784 and is currently estimated at $694,191, approximately $619 per square foot. 2007 Springcreek Cir is a home located in San Bernardino County with nearby schools including Pepper Tree Elementary, Pioneer Junior High School, and Upland High School.
Ownership History
Date
Name
Owned For
Owner Type
Purchase Details
Closed on
Nov 20, 2006
Sold by
Yost Timothy J
Bought by
Yost Timothy and Yost Christina M
Current Estimated Value
Home Financials for this Owner
Home Financials are based on the most recent Mortgage that was taken out on this home.
Original Mortgage
$89,350
Interest Rate
6.36%
Mortgage Type
New Conventional
Purchase Details
Closed on
Oct 11, 2004
Sold by
Barbee John
Bought by
Yost Timothy J and Lento Christie M
Home Financials for this Owner
Home Financials are based on the most recent Mortgage that was taken out on this home.
Original Mortgage
$282,400
Interest Rate
5.25%
Mortgage Type
New Conventional
Create a Home Valuation Report for This Property
The Home Valuation Report is an in-depth analysis detailing your home's value as well as a comparison with similar homes in the area
Home Values in the Area
Average Home Value in this Area
Purchase History
| Date | Buyer | Sale Price | Title Company |
|---|---|---|---|
| Yost Timothy | -- | Fidelity National Title Co | |
| Yost Timothy J | $365,000 | Southland Title |
Source: Public Records
Mortgage History
| Date | Status | Borrower | Loan Amount |
|---|---|---|---|
| Closed | Yost Timothy | $89,350 | |
| Closed | Yost Timothy J | $59,000 | |
| Open | Yost Timothy J | $328,000 | |
| Closed | Yost Timothy J | $324,500 | |
| Closed | Yost Timothy J | $282,400 | |
| Previous Owner | Barbee John | $266,250 | |
| Closed | Yost Timothy J | $35,300 |
Source: Public Records
Tax History Compared to Growth
Tax History
| Year | Tax Paid | Tax Assessment Tax Assessment Total Assessment is a certain percentage of the fair market value that is determined by local assessors to be the total taxable value of land and additions on the property. | Land | Improvement |
|---|---|---|---|---|
| 2024 | $5,480 | $498,805 | $174,582 | $324,223 |
| 2023 | $5,398 | $489,025 | $171,159 | $317,866 |
| 2022 | $5,282 | $479,436 | $167,803 | $311,633 |
| 2021 | $5,276 | $470,036 | $164,513 | $305,523 |
| 2020 | $5,133 | $465,216 | $162,826 | $302,390 |
| 2019 | $5,116 | $456,094 | $159,633 | $296,461 |
| 2018 | $4,992 | $447,151 | $156,503 | $290,648 |
| 2017 | $4,747 | $428,900 | $149,900 | $279,000 |
| 2016 | $4,408 | $408,500 | $142,800 | $265,700 |
| 2015 | $4,165 | $389,000 | $136,000 | $253,000 |
| 2014 | $3,725 | $350,000 | $122,000 | $228,000 |
Source: Public Records
Map
Nearby Homes
- 2003 Springcreek Cir
- 1992 Moonbeam Cir
- 1179 W Rae Ct
- 1407 Brookdale Dr
- 1431 Sunrise Cir S
- 1407 Sunrise Cir N
- 2166 Malati Cir
- 2048 Birkdale Ave
- 1400 Ashley Place
- 1398 Carissa St
- 1430 Carissa St
- 1048 W 22nd St
- 1070 Nicholas St
- 2252 Verbena Ave
- 2245 Poppy Ave
- 2279 Wisteria Ave
- 2247 Bella Ave
- 2006 N Ukiah Way
- 1159 Sunset Ct
- 2112 N Vallejo Way
- 2007 Springcreek Cir
- 1316 Brookdale Dr
- 1324 Brookdale Dr
- 1310 Brookside Ct
- 2014 Springcreek Cir
- 2015 Creekwood Ln
- 2010 Springcreek Cir
- 1999 White Rabbit Trail
- 1330 Brookdale Dr
- 1302 Brookside Ct
- 2002 Springcreek Cir
- 2006 Springcreek Cir
- 2019 Creekwood Ln
- 1998 White Rabbit Trail
- 1296 Brookside Ct
- 1993 White Rabbit Trail
- 2025 Creekwood Ln
- 1336 Brookside Ct
- 1290 Brookside Ct
- 1268 Clearspring Dr