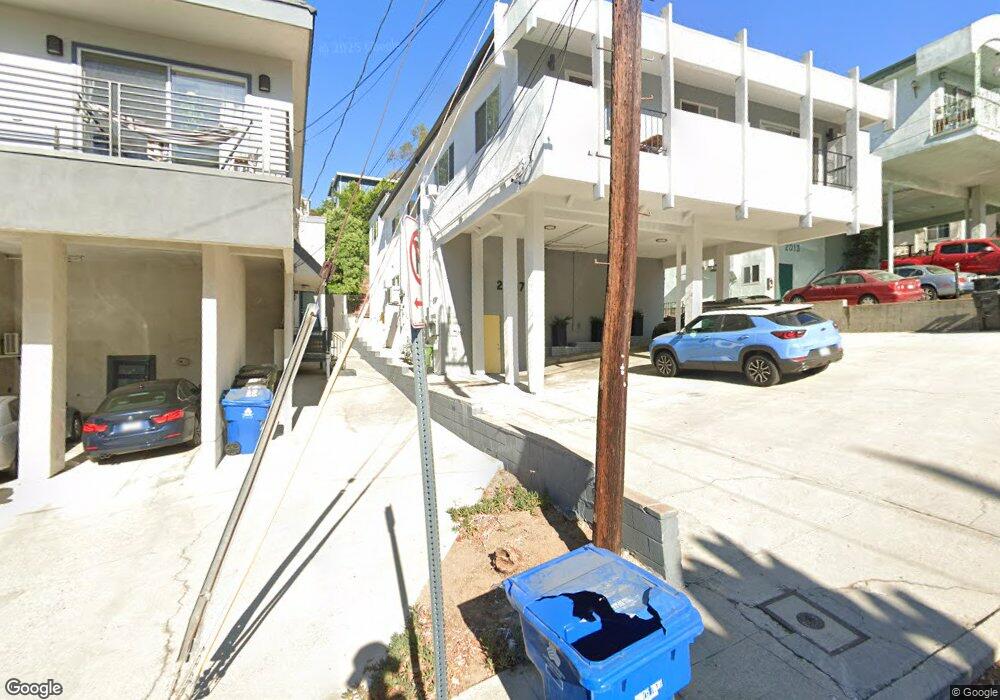
2007 Vestal Ave Los Angeles, CA 90026
Echo Park NeighborhoodEstimated Value: $1,539,000 - $2,476,000
9
Beds
5
Baths
4,514
Sq Ft
$443/Sq Ft
Est. Value
About This Home
This home is located at 2007 Vestal Ave, Los Angeles, CA 90026 and is currently estimated at $1,998,854, approximately $442 per square foot. 2007 Vestal Ave is a home located in Los Angeles County with nearby schools including Elysian Heights Elementary, Thomas Starr King Middle School Film and Media Magnet, and John Marshall Senior High.
Ownership History
Date
Name
Owned For
Owner Type
Purchase Details
Closed on
Jul 25, 2023
Sold by
Zavala Robert and Koegel Mark Eugene
Bought by
Roma 2023 Revocable Trust and Koegel
Current Estimated Value
Purchase Details
Closed on
Feb 17, 2006
Sold by
Zavala Robert
Bought by
Zavala Robert and Koegel Mark Eugene
Home Financials for this Owner
Home Financials are based on the most recent Mortgage that was taken out on this home.
Original Mortgage
$706,500
Interest Rate
6.04%
Mortgage Type
Fannie Mae Freddie Mac
Purchase Details
Closed on
Sep 5, 2001
Sold by
Kim Won Sang
Bought by
Zavala Robert and Koegel Mark Eugene
Home Financials for this Owner
Home Financials are based on the most recent Mortgage that was taken out on this home.
Original Mortgage
$384,000
Interest Rate
7.05%
Purchase Details
Closed on
Nov 3, 1999
Sold by
Kim Won Sang
Bought by
Kim Won Sang and Kim Yeun Sai
Create a Home Valuation Report for This Property
The Home Valuation Report is an in-depth analysis detailing your home's value as well as a comparison with similar homes in the area
Home Values in the Area
Average Home Value in this Area
Purchase History
| Date | Buyer | Sale Price | Title Company |
|---|---|---|---|
| Roma 2023 Revocable Trust | -- | None Listed On Document | |
| Zavala Robert | -- | Southland Title | |
| Zavala Robert | $480,000 | Fidelity National Title Co | |
| Kim Won Sang | -- | -- |
Source: Public Records
Mortgage History
| Date | Status | Borrower | Loan Amount |
|---|---|---|---|
| Previous Owner | Zavala Robert | $706,500 | |
| Previous Owner | Zavala Robert | $384,000 |
Source: Public Records
Tax History Compared to Growth
Tax History
| Year | Tax Paid | Tax Assessment Tax Assessment Total Assessment is a certain percentage of the fair market value that is determined by local assessors to be the total taxable value of land and additions on the property. | Land | Improvement |
|---|---|---|---|---|
| 2025 | $8,920 | $709,084 | $421,022 | $288,062 |
| 2024 | $8,920 | $695,181 | $412,767 | $282,414 |
| 2023 | $8,754 | $681,551 | $404,674 | $276,877 |
| 2022 | $8,358 | $668,189 | $396,740 | $271,449 |
| 2021 | $8,235 | $655,088 | $388,961 | $266,127 |
| 2019 | $7,995 | $635,660 | $377,425 | $258,235 |
| 2018 | $7,903 | $623,197 | $370,025 | $253,172 |
| 2016 | $7,517 | $598,999 | $355,657 | $243,342 |
| 2015 | $7,411 | $590,002 | $350,315 | $239,687 |
| 2014 | $7,458 | $578,445 | $343,453 | $234,992 |
Source: Public Records
Map
Nearby Homes
- 1956 Vestal Ave
- 1942 Lake Shore Ave
- 2136 Lemoyne St
- 2140 Lemoyne St
- 1545 Duane St
- 2124 Lake Shore Ave
- 2143 Lemoyne St
- 1574 Donaldson St
- 1501 Ewing St
- 2165 Valentine St Unit 2
- 2165 Valentine St Unit 1-3
- 2165 Valentine St Unit 1
- 2165 Valentine St Unit 3
- 2100 Avon St
- 1882 N Alvarado St Unit 16
- 2121 Baxter St
- 2201 Avon St
- 2222 Valentine St
- 2142 Baxter St
- 1444 Avon Terrace
- 2007 Vestal Ave Unit 2
- 2013 Vestal Ave
- 2001 Vestal Ave Unit 2
- 2001 Vestal Ave
- 2017 Vestal Ave
- 2021 Vestal Ave
- 2008 Lemoyne St
- 2002 Lemoyne St
- 1812 Ewing St
- 2012 Lemoyne St
- 1810 Ewing St
- 2016 Lemoyne St
- 2000 Vestal Ave
- 2006 Vestal Ave
- 2027 Vestal Ave
- 2012 Vestal Ave
- 2016 Vestal Ave
- 1957 Vestal Ave
- 2020 Lemoyne St
- 2020 Vestal Ave