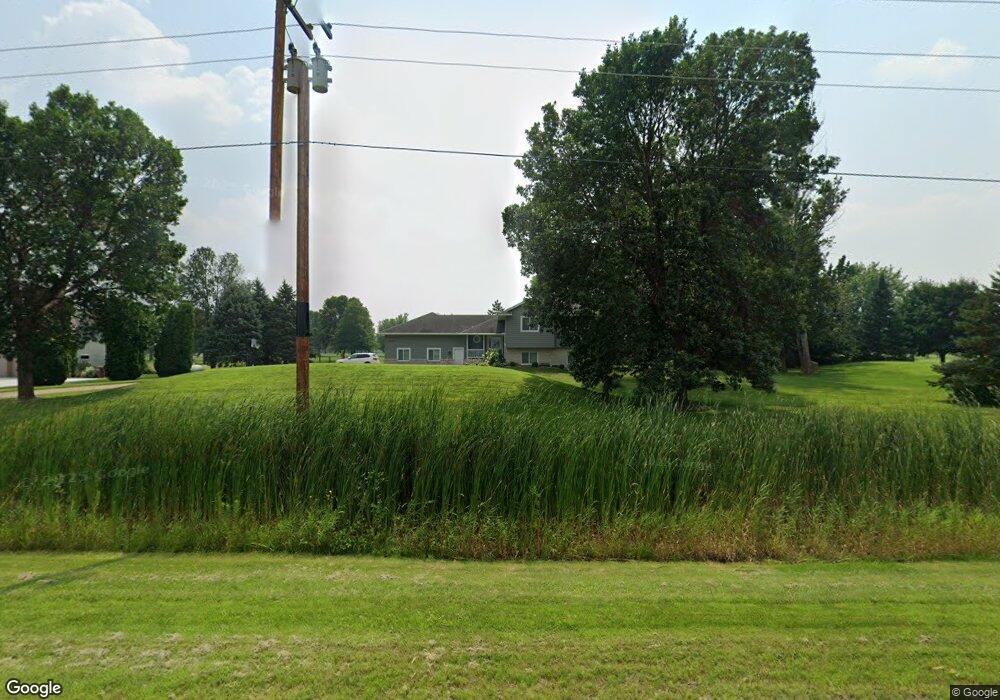
20075 County Road 117 Rogers, MN 55374
Estimated Value: $448,812 - $489,000
4
Beds
2
Baths
2,228
Sq Ft
$207/Sq Ft
Est. Value
About This Home
This home is located at 20075 County Road 117, Rogers, MN 55374 and is currently estimated at $460,953, approximately $206 per square foot. 20075 County Road 117 is a home located in Hennepin County with nearby schools including Hanover Elementary School, Buffalo Community Middle School, and Buffalo Senior High School.
Ownership History
Date
Name
Owned For
Owner Type
Purchase Details
Closed on
Mar 27, 2020
Sold by
Hedner Roderick M
Bought by
Gafurov Komron
Current Estimated Value
Home Financials for this Owner
Home Financials are based on the most recent Mortgage that was taken out on this home.
Original Mortgage
$310,650
Outstanding Balance
$274,148
Interest Rate
3.2%
Mortgage Type
New Conventional
Estimated Equity
$186,805
Purchase Details
Closed on
Mar 8, 2017
Sold by
Maus Gail P
Bought by
Hedner Roderick M
Home Financials for this Owner
Home Financials are based on the most recent Mortgage that was taken out on this home.
Original Mortgage
$256,500
Interest Rate
4.19%
Mortgage Type
New Conventional
Purchase Details
Closed on
Dec 20, 1999
Sold by
Nelson James L and Nelson Rosemary J
Bought by
Maus Craig D and Maus Gail P
Create a Home Valuation Report for This Property
The Home Valuation Report is an in-depth analysis detailing your home's value as well as a comparison with similar homes in the area
Home Values in the Area
Average Home Value in this Area
Purchase History
| Date | Buyer | Sale Price | Title Company |
|---|---|---|---|
| Gafurov Komron | $327,000 | Arden Title Llc | |
| Hedner Roderick M | $270,000 | Title Specialists Inc | |
| Maus Craig D | $199,000 | -- |
Source: Public Records
Mortgage History
| Date | Status | Borrower | Loan Amount |
|---|---|---|---|
| Open | Gafurov Komron | $310,650 | |
| Previous Owner | Hedner Roderick M | $256,500 |
Source: Public Records
Tax History Compared to Growth
Tax History
| Year | Tax Paid | Tax Assessment Tax Assessment Total Assessment is a certain percentage of the fair market value that is determined by local assessors to be the total taxable value of land and additions on the property. | Land | Improvement |
|---|---|---|---|---|
| 2024 | $4,772 | $392,700 | $90,000 | $302,700 |
| 2023 | $4,775 | $396,000 | $90,000 | $306,000 |
| 2022 | $4,586 | $378,000 | $90,000 | $288,000 |
| 2021 | $4,419 | $344,000 | $99,000 | $245,000 |
| 2020 | $4,508 | $325,000 | $88,000 | $237,000 |
| 2019 | $4,033 | $315,000 | $83,000 | $232,000 |
| 2018 | $3,989 | $301,000 | $83,000 | $218,000 |
| 2017 | $3,722 | $271,000 | $72,000 | $199,000 |
| 2016 | $3,684 | $264,000 | $80,000 | $184,000 |
| 2015 | $3,724 | $264,000 | $80,000 | $184,000 |
| 2014 | -- | $215,000 | $43,000 | $172,000 |
Source: Public Records
Map
Nearby Homes
- 10435 Northwood Ln
- 19674 105th Ave
- 10419 Northwood Ln
- 19661 105th Ave
- 19649 105th Ave
- 19638 105th Ave
- 19614 105th Ave
- 19602 105th Ave
- 19590 105th Ave
- 10366 Northwood Ln
- Newberry Plan at Amberly - Expressions
- Westchester Plan at Amberly - Expressions
- Greenfield Plan at Amberly - Expressions
- Continental Plan at Amberly - Expressions
- Linwood Plan at Amberly - Expressions
- 19525 104th Place
- 19920 Hillside Dr
- 19503 105th Ave
- 19504 103rd Ave
- 20090 Hunters Ridge
- 20055 County Road 117
- 20095 County Road 117
- 20125 County Road 117
- 20125 20125 County Road 117
- 20155 County Road 117
- 20155 20155 County Road 117
- 20175 County Road 117
- 20175 20175 County Road 117
- 20205 County Road 117
- 21250 109th Ave N
- 19850 Jackie Ln
- 19849 Jackie Ln
- 19840 Jackie Ln
- 19839 Jackie Ln
- 19830 Jackie Ln
- 19829 Jackie Ln
- 19820 Jackie Ln
- 10720 County Road 116
- 19817 Jackie Ln
- 19810 Jackie Ln