Estimated Value: $246,000 - $270,000
4
Beds
2
Baths
1,845
Sq Ft
$139/Sq Ft
Est. Value
About This Home
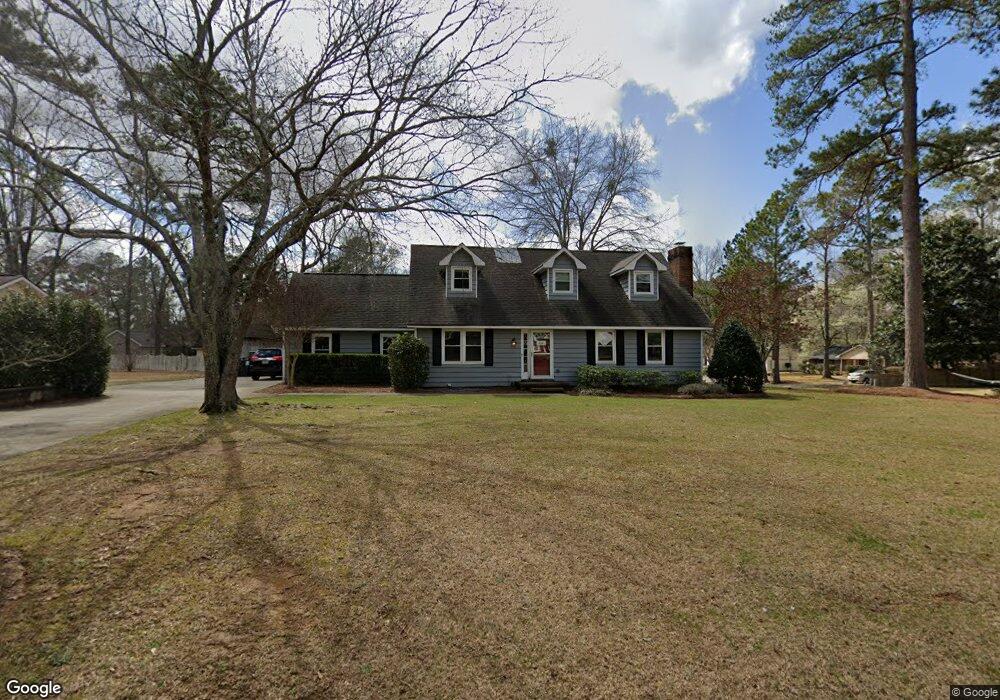
This home is located at 2008 Cedar Ridge Dr, Perry, GA 31069 and is currently estimated at $256,108, approximately $138 per square foot. 2008 Cedar Ridge Dr is a home located in Houston County with nearby schools including Morningside Elementary School, Perry Middle School, and Perry High School.
Ownership History
Date
Name
Owned For
Owner Type
Purchase Details
Closed on
Mar 2, 2007
Sold by
Walls Michael J
Bought by
Walls Michael J and Walls Angela K
Current Estimated Value
Home Financials for this Owner
Home Financials are based on the most recent Mortgage that was taken out on this home.
Original Mortgage
$132,905
Outstanding Balance
$80,137
Interest Rate
6.19%
Mortgage Type
New Conventional
Estimated Equity
$175,971
Purchase Details
Closed on
Oct 22, 1987
Sold by
Burleigh Thomas F and Burleigh Arthurlyn
Bought by
Emerson Dell R and Joyce M*
Purchase Details
Closed on
Sep 30, 1983
Sold by
Green Robert P and Gloria A*
Bought by
Burleigh Thomas F and Arthurlyn D*
Purchase Details
Closed on
Jan 30, 1981
Sold by
Kampschroeder Edward R and Kampschroeder Betty
Bought by
Green Robert P and Gloria A*
Purchase Details
Closed on
Aug 18, 1977
Sold by
Odom Tom
Bought by
Kampschroeder Edward R and Kampschroeder Betty L
Purchase Details
Closed on
Feb 4, 1977
Sold by
Culpepper Charles F Etal
Bought by
Odom Tom
Create a Home Valuation Report for This Property
The Home Valuation Report is an in-depth analysis detailing your home's value as well as a comparison with similar homes in the area
Home Values in the Area
Average Home Value in this Area
Purchase History
| Date | Buyer | Sale Price | Title Company |
|---|---|---|---|
| Walls Michael J | -- | None Available | |
| Walls Michael J | $139,900 | None Available | |
| Emerson Dell R | -- | -- | |
| Burleigh Thomas F | -- | -- | |
| Green Robert P | -- | -- | |
| Kampschroeder Edward R | -- | -- | |
| Odom Tom | -- | -- |
Source: Public Records
Mortgage History
| Date | Status | Borrower | Loan Amount |
|---|---|---|---|
| Open | Walls Michael J | $132,905 |
Source: Public Records
Tax History Compared to Growth
Tax History
| Year | Tax Paid | Tax Assessment Tax Assessment Total Assessment is a certain percentage of the fair market value that is determined by local assessors to be the total taxable value of land and additions on the property. | Land | Improvement |
|---|---|---|---|---|
| 2024 | $2,735 | $74,440 | $7,320 | $67,120 |
| 2023 | $2,297 | $62,080 | $7,320 | $54,760 |
| 2022 | $1,300 | $56,520 | $7,320 | $49,200 |
| 2021 | $1,177 | $50,920 | $7,320 | $43,600 |
| 2020 | $1,089 | $46,880 | $7,320 | $39,560 |
| 2019 | $1,089 | $46,880 | $7,320 | $39,560 |
| 2018 | $1,089 | $46,880 | $7,320 | $39,560 |
| 2017 | $1,090 | $46,880 | $7,320 | $39,560 |
| 2016 | $1,092 | $46,880 | $7,320 | $39,560 |
| 2015 | $1,094 | $46,880 | $7,320 | $39,560 |
| 2014 | -- | $46,880 | $7,320 | $39,560 |
| 2013 | -- | $46,880 | $7,320 | $39,560 |
Source: Public Records
Map
Nearby Homes
- 102 Wilton Cir
- 500 Legacy Park Dr
- 108 Cedar Ridge Dr
- 412 Legacy Park Dr
- 110 Gwendolyn Ave
- 104 Abby Gail Ln
- 314 Waxmyrtle Way
- 204 Susanne's Retreat
- 210 Susanne's Retreat
- 1414 Park Ave
- 1008 Ridge Cir S
- 303 Idle Pines Dr
- 102 Seven Pines Ct
- 108 Christine Cir
- 1402 Park Ave
- 1015 Country Club Rd
- 311 Rusty Plow Ln
- 308 Rusty Plow Ln
- 1926 Northside Rd
- 2006 Cedar Ridge Dr
- 1924 Azalea Dr
- 2004 Cedar Ridge Dr
- 1921 Northside Rd
- 1922 Azalea Dr
- 1919 Northside Rd
- 2009 Cedar Ridge Dr
- 2007 Cedar Ridge Dr
- 1913 Northside Rd
- 2011 Northside Rd
- 1920 Azalea Dr
- 2012 Northside Rd
- 2005 Cedar Ridge Dr
- 2013 Northside Rd
- 301 Cedar Ridge Dr
- 214 Windermere Dr
- 2016 Laurel Dr
- 2001 Cedar Ridge Dr
- 1918 Azalea Dr