Estimated Value: $535,000 - $661,549
4
Beds
3
Baths
2,092
Sq Ft
$290/Sq Ft
Est. Value
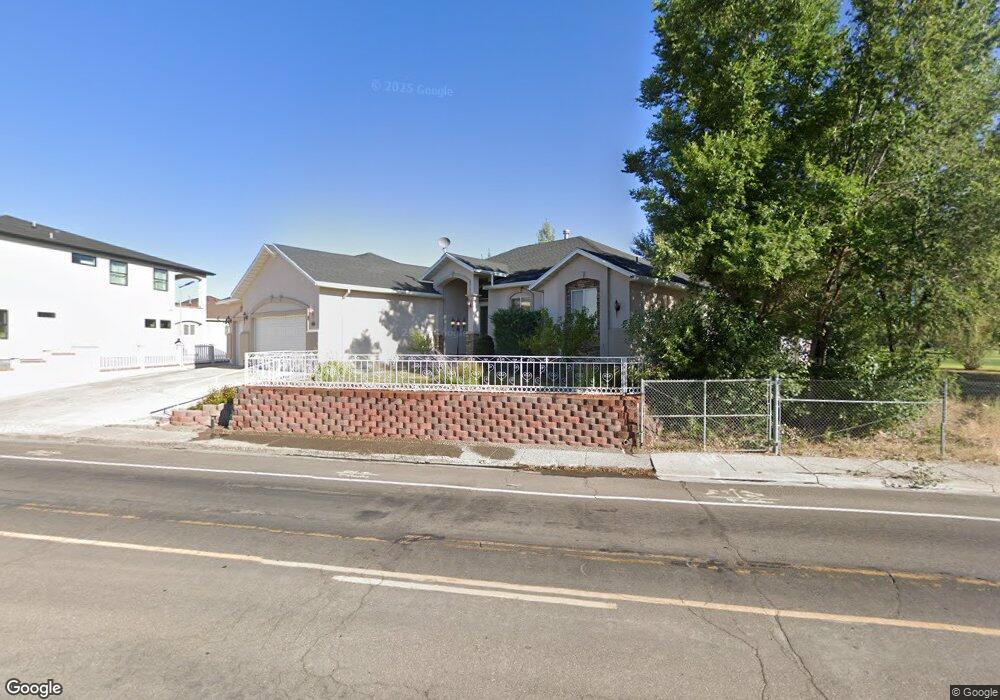
About This Home
This home is located at 2008 Ruby Vista Dr, Elko, NV 89801 and is currently estimated at $607,387, approximately $290 per square foot. 2008 Ruby Vista Dr is a home located in Elko County with nearby schools including Elko Grammar School #2, Flagview Intermediate School, and Adobe Middle School.
Ownership History
Date
Name
Owned For
Owner Type
Purchase Details
Closed on
Apr 24, 2007
Sold by
Carroll Tony G and Carroll Marianne
Bought by
Lara Rodolfo S and Lara Maria G
Current Estimated Value
Home Financials for this Owner
Home Financials are based on the most recent Mortgage that was taken out on this home.
Original Mortgage
$365,600
Outstanding Balance
$225,276
Interest Rate
6.5%
Mortgage Type
Purchase Money Mortgage
Estimated Equity
$382,112
Purchase Details
Closed on
Nov 21, 2006
Sold by
Carroll Joshua G and Carroll Kacee
Bought by
Carroll Tony G and Carroll Marianne
Home Financials for this Owner
Home Financials are based on the most recent Mortgage that was taken out on this home.
Original Mortgage
$376,000
Interest Rate
7.25%
Mortgage Type
Purchase Money Mortgage
Purchase Details
Closed on
Aug 29, 2005
Sold by
Lewis Lawrence J and Lewis Lauren
Bought by
Carroll Joshua G and Carroll Kacee
Create a Home Valuation Report for This Property
The Home Valuation Report is an in-depth analysis detailing your home's value as well as a comparison with similar homes in the area
Purchase History
| Date | Buyer | Sale Price | Title Company |
|---|---|---|---|
| Lara Rodolfo S | $457,000 | Stewart Title | |
| Carroll Tony G | $470,000 | Stewart Title | |
| Carroll Joshua G | $50,000 | Stewart Title |
Source: Public Records
Mortgage History
| Date | Status | Borrower | Loan Amount |
|---|---|---|---|
| Open | Lara Rodolfo S | $365,600 | |
| Previous Owner | Carroll Tony G | $376,000 |
Source: Public Records
Tax History
| Year | Tax Paid | Tax Assessment Tax Assessment Total Assessment is a certain percentage of the fair market value that is determined by local assessors to be the total taxable value of land and additions on the property. | Land | Improvement |
|---|---|---|---|---|
| 2025 | $6,191 | $210,034 | $40,250 | $169,784 |
| 2024 | $6,191 | $196,870 | $24,500 | $172,370 |
| 2023 | $5,629 | $185,110 | $24,500 | $160,610 |
| 2022 | $5,465 | $161,003 | $24,500 | $136,503 |
| 2021 | $5,306 | $156,920 | $24,500 | $132,420 |
| 2020 | $5,506 | $160,260 | $24,500 | $135,760 |
| 2019 | $4,730 | $135,789 | $21,000 | $114,789 |
| 2018 | $4,741 | $136,117 | $21,000 | $115,117 |
| 2017 | $4,669 | $134,050 | $21,000 | $113,050 |
| 2016 | $4,656 | $132,641 | $21,000 | $111,641 |
| 2015 | $4,519 | $128,912 | $21,000 | $107,912 |
| 2014 | $4,389 | $123,607 | $21,000 | $102,607 |
Source: Public Records
Map
Nearby Homes
- 914 Country Club Dr
- 2084 Golf Dr
- 207 Palmers Ct
- 1800 Ruby View Dr Unit 2
- 201 Palmers Ct
- 2215 Ruby Vista Dr
- 1275 Ruby Vista Dr
- 2426 Khoury Ln
- 2366 Khoury Ln
- 2464 Puccinelli Pkwy
- 2001 Eagle Dr Unit 1
- 2009 Eagle Dr Unit 3
- 2653 Mesquite Way
- 2966 Lecomte Ct
- 2950 Lecomte Ct
- 2667 Mesquite Way
- 2678 Mesquite Way
- 2405 Puccinelli Pkwy
- 2675 Mesquite Way
- 2682 Mesquite Way
- 1848 Sequoia Dr
- 1844 Sequoia Dr
- 1837 Sequoia Dr
- 1832 Sequoia Dr
- 1835 Sequoia Dr
- 1828 Sequoia Dr
- 1831 Sequoia Dr
- 959 Country Club Dr
- 955 Country Club Dr
- 954 Country Club Dr
- 1829 Sequoia Dr
- 965 Country Club Dr
- 949 Country Club Dr
- 964 Country Club Dr
- 944 Country Club Dr
- 1820 Sequoia Dr
- 975 Country Club Dr
- 939 Country Club Dr
- 1825 Sequoia Dr
- 974 Country Club Dr