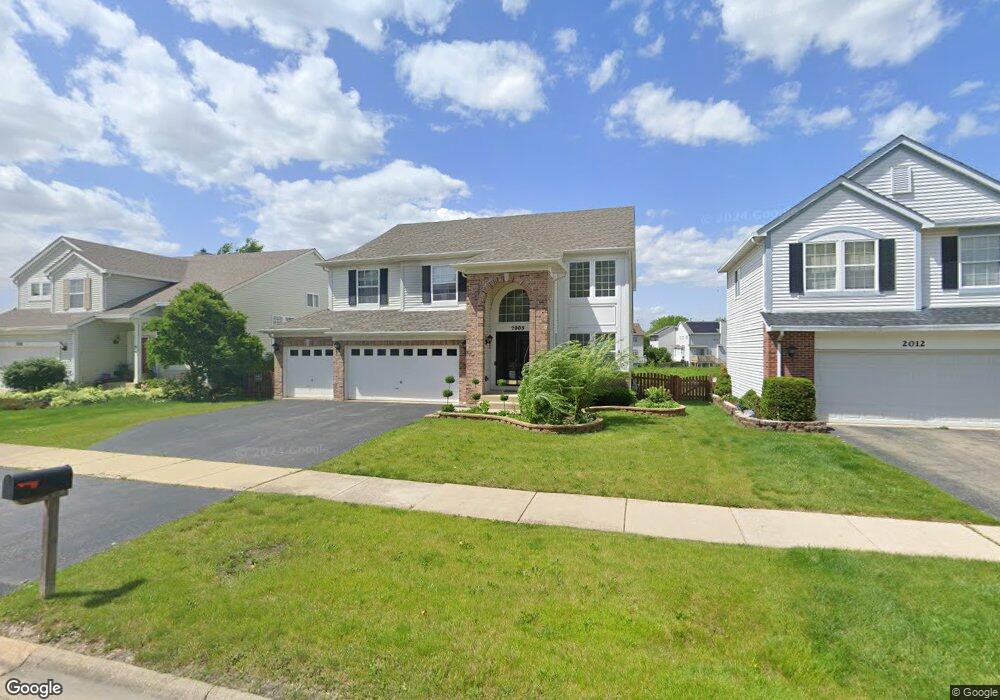
2008 Sudbury Ln Naperville, IL 60564
Springbrook Prairie NeighborhoodEstimated Value: $622,000 - $682,219
4
Beds
3
Baths
2,834
Sq Ft
$230/Sq Ft
Est. Value
About This Home
This home is located at 2008 Sudbury Ln, Naperville, IL 60564 and is currently estimated at $651,055, approximately $229 per square foot. 2008 Sudbury Ln is a home located in DuPage County with nearby schools including Welch Elementary School, Scullen Middle School, and Neuqua Valley High School.
Ownership History
Date
Name
Owned For
Owner Type
Purchase Details
Closed on
Jan 29, 2021
Sold by
Regalado Raymond and Regalado Maria
Bought by
Ansari Ihtesham and Ansari Asma
Current Estimated Value
Home Financials for this Owner
Home Financials are based on the most recent Mortgage that was taken out on this home.
Original Mortgage
$374,440
Outstanding Balance
$332,955
Interest Rate
2.37%
Mortgage Type
FHA
Estimated Equity
$318,100
Purchase Details
Closed on
Sep 8, 1998
Sold by
Pinnacle Corp
Bought by
Regalado Raymond and Regalado Maria
Home Financials for this Owner
Home Financials are based on the most recent Mortgage that was taken out on this home.
Original Mortgage
$185,900
Interest Rate
7.02%
Create a Home Valuation Report for This Property
The Home Valuation Report is an in-depth analysis detailing your home's value as well as a comparison with similar homes in the area
Home Values in the Area
Average Home Value in this Area
Purchase History
| Date | Buyer | Sale Price | Title Company |
|---|---|---|---|
| Ansari Ihtesham | $412,500 | Fort Dearborn Land Title | |
| Regalado Raymond | $256,000 | -- |
Source: Public Records
Mortgage History
| Date | Status | Borrower | Loan Amount |
|---|---|---|---|
| Open | Ansari Ihtesham | $374,440 | |
| Previous Owner | Regalado Raymond | $185,900 |
Source: Public Records
Tax History Compared to Growth
Tax History
| Year | Tax Paid | Tax Assessment Tax Assessment Total Assessment is a certain percentage of the fair market value that is determined by local assessors to be the total taxable value of land and additions on the property. | Land | Improvement |
|---|---|---|---|---|
| 2024 | $11,816 | $197,306 | $46,875 | $150,431 |
| 2023 | $11,319 | $177,290 | $42,120 | $135,170 |
| 2022 | $10,882 | $165,230 | $38,940 | $126,290 |
| 2021 | $10,540 | $159,330 | $37,550 | $121,780 |
| 2020 | $10,525 | $159,330 | $37,550 | $121,780 |
| 2019 | $10,112 | $151,540 | $35,710 | $115,830 |
| 2018 | $10,677 | $156,830 | $37,180 | $119,650 |
| 2017 | $10,384 | $151,510 | $35,920 | $115,590 |
| 2016 | $10,197 | $145,400 | $34,470 | $110,930 |
| 2015 | $10,105 | $138,060 | $32,730 | $105,330 |
| 2014 | $9,916 | $125,090 | $29,420 | $95,670 |
| 2013 | $9,889 | $125,950 | $29,620 | $96,330 |
Source: Public Records
Map
Nearby Homes
- 2016 Fulham Dr
- 2211 Skylane Dr
- 2228 Foxboro Ln
- 2203 Fox Boro Ln
- 2806 Vernal Ln
- 2220 Waterleaf Ct Unit 204
- 2211 Waterleaf Ct Unit 204
- 2219 Waterleaf Ct Unit 203
- 9S151 Skylane Dr
- 2247 Palmer Cir
- 2255 Palmer Cir
- 4258 Stableford Ln
- 9S104 Aero Dr
- 2503 Sheehan Dr Unit 104
- 2611 Cedar Glade Dr Unit 204
- 2611 Cedar Glade Dr Unit 201
- 2124 Leverenz Rd
- 2809 Alameda Ct
- 4328 Chelsea Manor Cir
- 2545 Eldorado Ln
- 2008 Sudbury St
- 2004 Sudbury Ln
- 2012 Sudbury Ln
- 2016 Sudbury Ln
- 2007 Sudbury St
- 2003 Sudbury St Unit 5
- 2011 Sudbury St Unit 5
- 2020 Sudbury Ln Unit 5
- 2015 Sudbury St
- 2024 Sudbury Ln
- 2008 Skylane Dr
- 2035 Sudbury St
- 2503 Boddington Ln
- 2507 Boddington Ln
- 2028 Sudbury Ln
- 2511 Boddington Ln
- 2039 Sudbury St
- 2012 Skylane Dr
- 2032 Sudbury Ln
- 2515 Boddington Ln