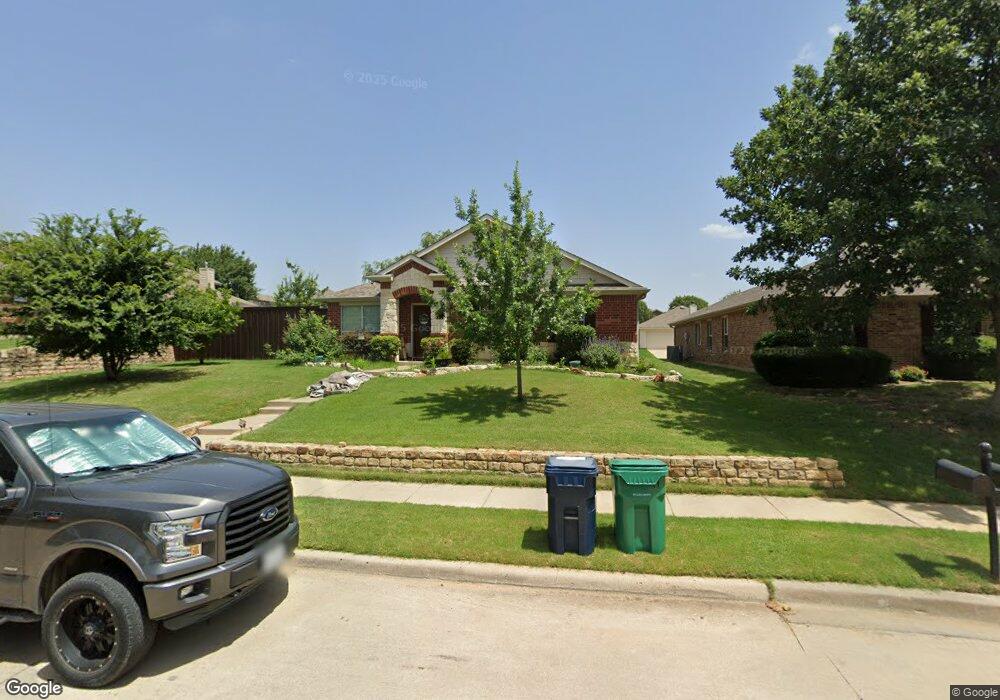
2009 Del Mar Ct Denton, TX 76210
South Denton NeighborhoodEstimated Value: $380,000 - $397,000
3
Beds
2
Baths
1,936
Sq Ft
$200/Sq Ft
Est. Value
About This Home
This home is located at 2009 Del Mar Ct, Denton, TX 76210 and is currently estimated at $388,002, approximately $200 per square foot. 2009 Del Mar Ct is a home located in Denton County with nearby schools including Ryan Elementary School, Crownover Middle School, and Guyer High School.
Ownership History
Date
Name
Owned For
Owner Type
Purchase Details
Closed on
Dec 9, 2020
Sold by
Hunninghaus Paul Joseph
Bought by
Hunninghaus Paul Joseph
Current Estimated Value
Purchase Details
Closed on
Mar 17, 2010
Sold by
Priceless Designs Inc
Bought by
Hunninghaus Paul J and Hunninghaus Reysa
Home Financials for this Owner
Home Financials are based on the most recent Mortgage that was taken out on this home.
Original Mortgage
$158,332
Outstanding Balance
$103,954
Interest Rate
4.95%
Mortgage Type
VA
Estimated Equity
$284,048
Purchase Details
Closed on
Dec 14, 2009
Sold by
Garay Carlos A and Pedregon Christine D
Bought by
Priceless Designs Inc
Purchase Details
Closed on
May 31, 2006
Sold by
Ashton Dallas Residential Llc
Bought by
Garay Carlos A and Pedregon Christine D
Home Financials for this Owner
Home Financials are based on the most recent Mortgage that was taken out on this home.
Original Mortgage
$136,584
Interest Rate
6.78%
Mortgage Type
Purchase Money Mortgage
Create a Home Valuation Report for This Property
The Home Valuation Report is an in-depth analysis detailing your home's value as well as a comparison with similar homes in the area
Home Values in the Area
Average Home Value in this Area
Purchase History
| Date | Buyer | Sale Price | Title Company |
|---|---|---|---|
| Hunninghaus Paul Joseph | -- | None Available | |
| Hunninghaus Paul J | -- | Commonwealth | |
| Priceless Designs Inc | $112,000 | None Available | |
| Garay Carlos A | -- | Stewart Title |
Source: Public Records
Mortgage History
| Date | Status | Borrower | Loan Amount |
|---|---|---|---|
| Open | Hunninghaus Paul J | $158,332 | |
| Previous Owner | Garay Carlos A | $136,584 |
Source: Public Records
Tax History Compared to Growth
Tax History
| Year | Tax Paid | Tax Assessment Tax Assessment Total Assessment is a certain percentage of the fair market value that is determined by local assessors to be the total taxable value of land and additions on the property. | Land | Improvement |
|---|---|---|---|---|
| 2025 | $5,724 | $373,617 | $105,446 | $268,171 |
| 2024 | $6,920 | $358,505 | $0 | $0 |
| 2023 | $5,026 | $325,914 | $105,446 | $308,021 |
| 2022 | $6,290 | $296,285 | $86,274 | $231,233 |
| 2021 | $5,988 | $269,350 | $53,202 | $216,148 |
| 2020 | $5,622 | $245,960 | $53,202 | $192,758 |
| 2019 | $5,564 | $233,200 | $53,202 | $190,951 |
| 2018 | $5,121 | $212,000 | $53,202 | $158,798 |
| 2017 | $4,894 | $198,000 | $53,202 | $149,769 |
| 2016 | $4,449 | $180,000 | $53,202 | $126,798 |
| 2015 | $4,000 | $181,457 | $41,699 | $139,758 |
| 2014 | $4,000 | $170,500 | $41,699 | $128,833 |
| 2013 | -- | $155,000 | $41,699 | $113,301 |
Source: Public Records
Map
Nearby Homes
- 2005 Creekdale Dr
- 1917 Belmont Park Dr
- 2112 Del Mar Ct
- 1917 Prescott Downs Dr
- 4613 Bernstein Blvd
- 1913 Pavilion Ln
- 4125 Colina Ave
- 2109 Hemingway Dr
- 1517 Miranda Ln
- 2316 Del Mar Ct
- 4100 Fanita Place
- 2401 Creekdale Dr
- 7100 Frost Ln
- 2412 Miranda Place
- 7301 Chaucer Dr
- 1605 Cordero Ct
- 3933 Parkhaven Dr
- 5718 Green Ivy Rd
- 7305 Mira Vista Dr
- 1617 Glendora Ct
- 2013 Del Mar Ct
- 2005 Del Mar Ct
- 2008 Creekdale Dr
- 2017 Del Mar Ct
- 2004 Creekdale Dr
- 2012 Creekdale Dr
- 2008 Del Mar Ct
- 2001 Del Mar Ct
- 2004 Del Mar Ct
- 2012 Del Mar Ct
- 2016 Creekdale Dr
- 2000 Creekdale Dr
- 2021 Del Mar Ct
- 2000 Del Mar Ct
- 2016 Del Mar Ct
- 2020 Creekdale Dr
- 1916 Creekdale Dr
- 1916 Del Mar Ct
- 2020 Del Mar Ct
- 2009 Belmont Park Dr