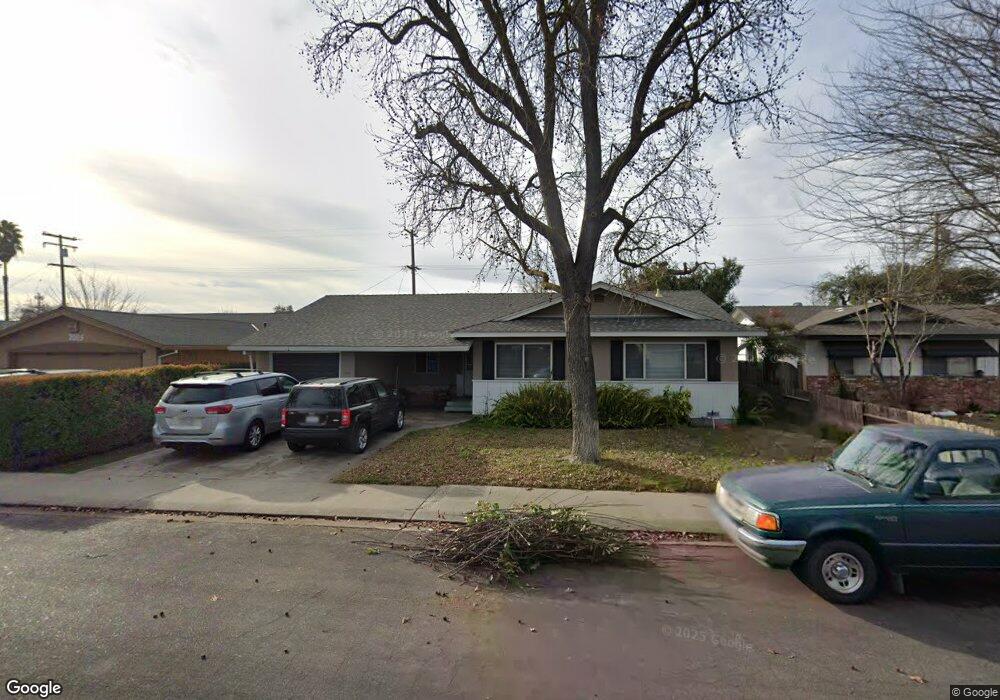
2009 Reseda Ln Modesto, CA 95350
Central Modesto NeighborhoodEstimated Value: $356,000 - $405,000
3
Beds
2
Baths
1,225
Sq Ft
$318/Sq Ft
Est. Value
About This Home
This home is located at 2009 Reseda Ln, Modesto, CA 95350 and is currently estimated at $389,332, approximately $317 per square foot. 2009 Reseda Ln is a home located in Stanislaus County with nearby schools including Standiford Elementary School, Somerset Middle School, and Fred C. Beyer High School.
Ownership History
Date
Name
Owned For
Owner Type
Purchase Details
Closed on
Oct 17, 2016
Sold by
Tanis Matthew P and Tanis Matthew
Bought by
Tanis Matthew P and Tanis Tegan R
Current Estimated Value
Home Financials for this Owner
Home Financials are based on the most recent Mortgage that was taken out on this home.
Original Mortgage
$169,000
Outstanding Balance
$135,399
Interest Rate
3.44%
Mortgage Type
New Conventional
Estimated Equity
$253,933
Purchase Details
Closed on
Feb 3, 2010
Sold by
California Equity Management Group Inc
Bought by
Tanis Matthew
Home Financials for this Owner
Home Financials are based on the most recent Mortgage that was taken out on this home.
Original Mortgage
$126,663
Interest Rate
5.5%
Mortgage Type
FHA
Purchase Details
Closed on
Aug 26, 2009
Sold by
Boone Brett
Bought by
California Equity Management Group Inc
Purchase Details
Closed on
Oct 4, 2005
Sold by
Fryar Elaine A
Bought by
Boone Brett
Create a Home Valuation Report for This Property
The Home Valuation Report is an in-depth analysis detailing your home's value as well as a comparison with similar homes in the area
Home Values in the Area
Average Home Value in this Area
Purchase History
| Date | Buyer | Sale Price | Title Company |
|---|---|---|---|
| Tanis Matthew P | -- | Old Republic Title Company | |
| Tanis Matthew | -- | Old Republic Title Company | |
| California Equity Management Group Inc | $70,000 | None Available | |
| Boone Brett | -- | -- |
Source: Public Records
Mortgage History
| Date | Status | Borrower | Loan Amount |
|---|---|---|---|
| Open | Tanis Matthew P | $169,000 | |
| Closed | Tanis Matthew | $126,663 |
Source: Public Records
Tax History Compared to Growth
Tax History
| Year | Tax Paid | Tax Assessment Tax Assessment Total Assessment is a certain percentage of the fair market value that is determined by local assessors to be the total taxable value of land and additions on the property. | Land | Improvement |
|---|---|---|---|---|
| 2025 | $1,762 | $166,500 | $45,171 | $121,329 |
| 2024 | $1,729 | $163,236 | $44,286 | $118,950 |
| 2023 | $1,695 | $160,036 | $43,418 | $116,618 |
| 2022 | $1,625 | $156,899 | $42,567 | $114,332 |
| 2021 | $1,595 | $153,824 | $41,733 | $112,091 |
| 2020 | $1,571 | $152,248 | $41,306 | $110,942 |
| 2019 | $1,541 | $149,264 | $40,497 | $108,767 |
| 2018 | $1,509 | $146,338 | $39,703 | $106,635 |
| 2017 | $1,472 | $143,470 | $38,925 | $104,545 |
| 2016 | $1,462 | $140,658 | $38,162 | $102,496 |
| 2015 | $1,439 | $138,546 | $37,589 | $100,957 |
| 2014 | $1,432 | $135,833 | $36,853 | $98,980 |
Source: Public Records
Map
Nearby Homes
- 2104 La Veta Ct
- 1177 Norwegian Ave Unit 46
- 2109 Bodega Ln
- 1005 Pasadena Ln
- 1122 Huntington Dr
- 809 Carrigan Ave
- 1313 Floyd Ave Unit 129
- 1313 Floyd Ave Unit 126
- 2201 Presidio Ave
- 1528 Citrus Dr
- 1813 Murrietta Ln
- 1508 Rosario Ave
- 1112 Valencia Ct
- 2700 Berwick Ct
- 1600 E Coolidge Ave
- 1535 Melrose Ave
- 1444 Casa Blanca Ct
- 1320 Coffee Villa Dr
- 2025 Ellison Dr
- 2409 Pridmore Ave
- 2013 Reseda Ln
- 2005 Reseda Ln
- 2008 La Veta Ct
- 2004 La Veta Ct
- 2101 Reseda Ln
- 2001 Reseda Ln
- 2008 Reseda Ln
- 2100 La Veta Ct
- 2012 Reseda Ln
- 2004 Reseda Ln
- 2000 La Veta Ct
- 2105 Reseda Ln
- 2100 Reseda Ln
- 1941 Reseda Ln
- 2000 Reseda Ln
- 2104 Reseda Ln
- 1940 Reseda Ln
- 1208 Athens Ave
- 2013 La Veta Ct
- 2009 La Veta Ct