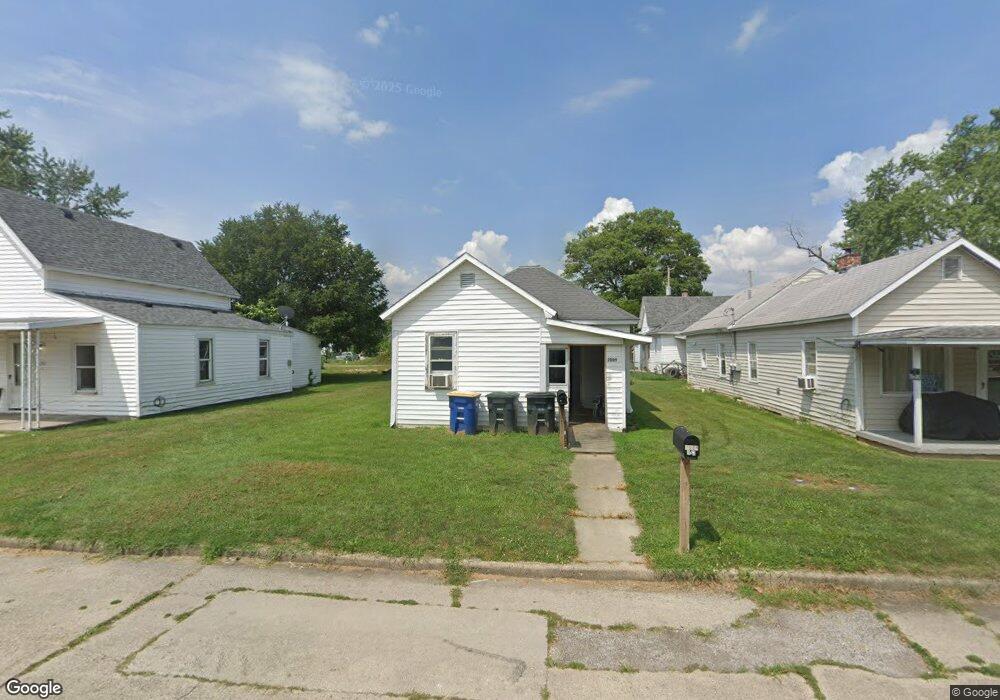
2009 S Penn St Unit 2 Muncie, IN 47302
Southside NeighborhoodEstimated Value: $73,000 - $84,000
2
Beds
1
Bath
744
Sq Ft
$106/Sq Ft
Est. Value
About This Home
This home is located at 2009 S Penn St Unit 2, Muncie, IN 47302 and is currently estimated at $79,172, approximately $106 per square foot. 2009 S Penn St Unit 2 is a home located in Delaware County with nearby schools including Grissom Memorial Elementary School, Muncie Central High School, and Southside Middle School.
Ownership History
Date
Name
Owned For
Owner Type
Purchase Details
Closed on
Dec 17, 2021
Sold by
Johnson Jr Arthur P
Bought by
Arthur And Nicole Johnson Living Trust and Livi Nicole
Current Estimated Value
Purchase Details
Closed on
Sep 5, 2019
Sold by
Double G Properties Llc
Bought by
Johnson Arthur P
Purchase Details
Closed on
Aug 13, 2015
Sold by
Laderman Marvin
Bought by
Double G Properties Llc
Home Financials for this Owner
Home Financials are based on the most recent Mortgage that was taken out on this home.
Original Mortgage
$41,600
Interest Rate
4.09%
Mortgage Type
New Conventional
Purchase Details
Closed on
Mar 17, 2011
Sold by
Mutualbank
Bought by
Laderman Marvin
Purchase Details
Closed on
Sep 15, 2010
Sold by
Winningham Jesse R and Winningham June R
Bought by
Mutualbank
Create a Home Valuation Report for This Property
The Home Valuation Report is an in-depth analysis detailing your home's value as well as a comparison with similar homes in the area
Home Values in the Area
Average Home Value in this Area
Purchase History
| Date | Buyer | Sale Price | Title Company |
|---|---|---|---|
| Arthur And Nicole Johnson Living Trust | -- | Frank & Krafts | |
| Johnson Arthur P | -- | Frank & Kraft | |
| Johnson Arthur P | -- | None Available | |
| Double G Properties Llc | -- | -- | |
| Laderman Marvin | -- | Itic | |
| Mutualbank | $7,250 | None Available |
Source: Public Records
Mortgage History
| Date | Status | Borrower | Loan Amount |
|---|---|---|---|
| Previous Owner | Double G Properties Llc | $41,600 |
Source: Public Records
Tax History Compared to Growth
Tax History
| Year | Tax Paid | Tax Assessment Tax Assessment Total Assessment is a certain percentage of the fair market value that is determined by local assessors to be the total taxable value of land and additions on the property. | Land | Improvement |
|---|---|---|---|---|
| 2024 | $974 | $42,800 | $4,900 | $37,900 |
| 2023 | $956 | $41,900 | $4,000 | $37,900 |
| 2022 | $884 | $38,300 | $4,000 | $34,300 |
| 2021 | $720 | $30,100 | $3,700 | $26,400 |
| 2020 | $602 | $24,200 | $3,700 | $20,500 |
| 2019 | $580 | $23,100 | $3,500 | $19,600 |
| 2018 | $644 | $26,300 | $3,700 | $22,600 |
| 2017 | $650 | $26,600 | $4,100 | $22,500 |
| 2016 | $636 | $25,900 | $4,100 | $21,800 |
| 2014 | $493 | $22,000 | $4,100 | $17,900 |
| 2013 | -- | $21,500 | $4,100 | $17,400 |
Source: Public Records
Map
Nearby Homes
- 2112 S Beacon St
- 2210 S Penn St
- 2115 S Ebright St
- 1921 S Hackley St
- 1224 S Beacon St
- 1511 E 20th St
- 1715 S Madison St
- 1303 S Shipley St
- 1304 S Shipley St
- 1202 S Shipley St
- 1805 E 20th St
- 2815 S Pershing Dr
- 623 E Willard St
- 2901 S Pershing Dr
- 1206 S Madison St
- 2911 S Hackley St
- 2823 S Vine St
- 2000 S Walnut St
- 1400 E 24th St
- 218 E 8th St
- 2009 S Penn St
- 2011 S Penn St
- 2007 S Penn St
- 2009 S Penn St Unit 2
- 2013 1/2 S Penn St
- 2013 S Penn St
- 2013 S Penn St Unit 2013 & 2013 1/2
- 2015 S Penn St
- 2008 S Grant St
- 2017 S Penn St
- 2014 S Grant St
- 1216 E 13th St
- 1214 E 13th St
- 1218 E 13th St
- 1210 E 13th St
- 2018 S Grant St
- 2023 S Penn St
- 1208 E 13th St
- 2020 S Grant St
- 1206 E 13th St