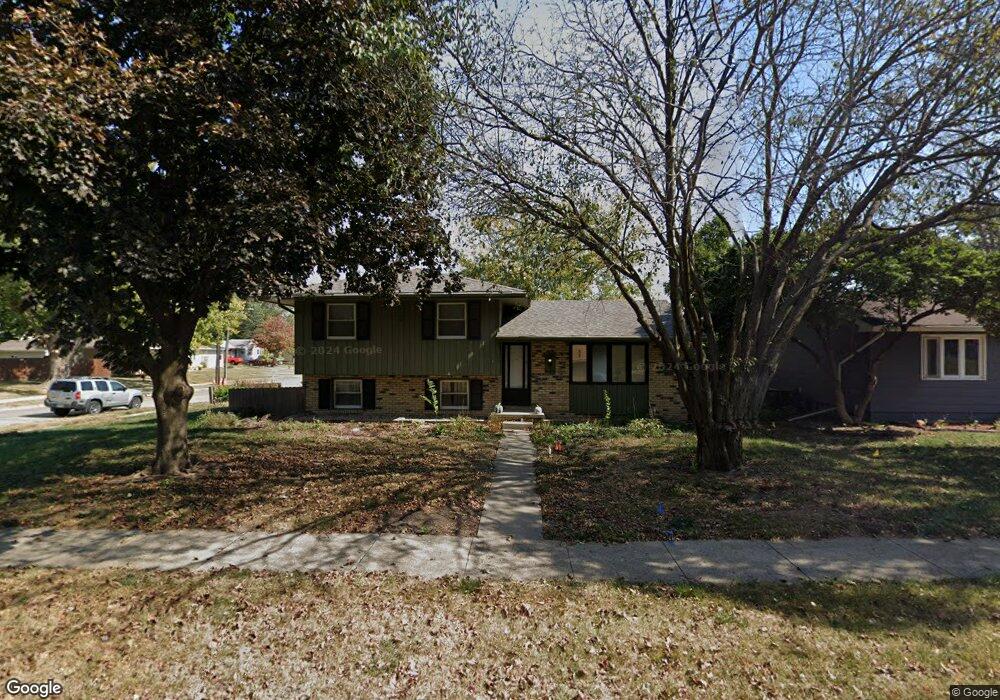
201 12th Ave SW Altoona, IA 50009
Estimated Value: $259,000 - $276,188
3
Beds
2
Baths
1,074
Sq Ft
$249/Sq Ft
Est. Value
About This Home
This home is located at 201 12th Ave SW, Altoona, IA 50009 and is currently estimated at $267,047, approximately $248 per square foot. 201 12th Ave SW is a home located in Polk County with nearby schools including Willowbrook Elementary School, Southeast Polk Spring Creek- 6th Grade, and Southeast Polk Junior High School.
Ownership History
Date
Name
Owned For
Owner Type
Purchase Details
Closed on
Aug 31, 2021
Sold by
Bliss Christopher A
Bought by
Temperly Austin Sidney
Current Estimated Value
Home Financials for this Owner
Home Financials are based on the most recent Mortgage that was taken out on this home.
Original Mortgage
$224,500
Outstanding Balance
$203,832
Interest Rate
2.8%
Mortgage Type
VA
Estimated Equity
$63,215
Purchase Details
Closed on
May 30, 2012
Sold by
Smith Dina D and Smith David C
Bought by
Smith Dina D
Purchase Details
Closed on
Feb 18, 2012
Sold by
Dedecker Terry and Dedecker Janet
Bought by
Smith Dina
Home Financials for this Owner
Home Financials are based on the most recent Mortgage that was taken out on this home.
Original Mortgage
$140,390
Interest Rate
4.01%
Mortgage Type
FHA
Purchase Details
Closed on
Feb 28, 2007
Sold by
Alexander Harlan Eugene and Alexander Alice Louise
Bought by
Dedecker Terry and Dedecker Janet
Create a Home Valuation Report for This Property
The Home Valuation Report is an in-depth analysis detailing your home's value as well as a comparison with similar homes in the area
Home Values in the Area
Average Home Value in this Area
Purchase History
| Date | Buyer | Sale Price | Title Company |
|---|---|---|---|
| Temperly Austin Sidney | $227,000 | None Available | |
| Bliss Christopher A | -- | None Available | |
| Smith Dina D | -- | None Available | |
| Smith Dina | $149,500 | None Available | |
| Dedecker Terry | $154,500 | Itc |
Source: Public Records
Mortgage History
| Date | Status | Borrower | Loan Amount |
|---|---|---|---|
| Open | Temperly Austin Sidney | $224,500 | |
| Previous Owner | Smith Dina | $140,390 |
Source: Public Records
Tax History Compared to Growth
Tax History
| Year | Tax Paid | Tax Assessment Tax Assessment Total Assessment is a certain percentage of the fair market value that is determined by local assessors to be the total taxable value of land and additions on the property. | Land | Improvement |
|---|---|---|---|---|
| 2025 | $4,388 | $283,400 | $57,000 | $226,400 |
| 2024 | $4,388 | $254,700 | $50,400 | $204,300 |
| 2023 | $4,320 | $254,700 | $50,400 | $204,300 |
| 2022 | $4,084 | $211,700 | $43,500 | $168,200 |
| 2021 | $3,894 | $211,700 | $43,500 | $168,200 |
| 2020 | $3,826 | $192,500 | $39,900 | $152,600 |
| 2019 | $3,546 | $192,500 | $39,900 | $152,600 |
| 2018 | $3,548 | $175,700 | $35,600 | $140,100 |
| 2017 | $3,586 | $175,700 | $35,600 | $140,100 |
| 2016 | $3,574 | $161,400 | $32,400 | $129,000 |
| 2015 | $3,574 | $161,400 | $32,400 | $129,000 |
| 2014 | $3,418 | $152,000 | $30,600 | $121,400 |
Source: Public Records
Map
Nearby Homes
- 106 12th Ave NW
- 202 11th Ave NW
- 213 10th Ave SW
- 150 10th Ave SW
- 107 10th Ave SW
- 345 13th Ave SW Unit 17
- 308 11th Ave NW
- 302 12th Ave NW
- 1103 4th St NW
- 1605 2nd St NW
- 1699 Glade Dr SW
- 612 12th Ave NW
- 1028 7th St NW
- 1005 6th St NW
- 1634 Prairie Cir
- 215 19th Ave SW
- 548 6th St NW
- 507 4th St NW
- 713 17th Ave SW
- 1901 5th St SW
- 201 12th Ave SW
- 203 12th Ave SW
- 205 12th Ave SW
- 202 11th Ave SW
- 1109 2nd St SW
- 204 11th Ave SW
- 202 12th Ave SW
- 200 12th Ave SW
- 204 12th Ave SW
- 207 12th Ave SW
- 206 11th Ave SW
- 105 12th Ave SW
- 206 12th Ave SW
- 108 12th Ave SW
- 1105 2nd St SW
- 208 11th Ave SW
- 208 12th Ave SW
- 106 12th Ave SW
- 209 12th Ave SW
- 931 2nd St SW