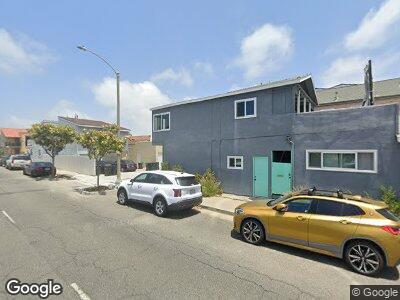
201 28th St Unit 2 Newport Beach, CA 92663
West Newport Beach NeighborhoodEstimated Value: $2,135,000 - $2,845,000
1
Bed
1
Bath
551
Sq Ft
$4,364/Sq Ft
Est. Value
About This Home
This home is located at 201 28th St Unit 2, Newport Beach, CA 92663 and is currently estimated at $2,404,688, approximately $4,364 per square foot. 201 28th St Unit 2 is a home located in Orange County with nearby schools including Newport Elementary School, Horace Ensign Intermediate School, and Newport Harbor High School.
Ownership History
Date
Name
Owned For
Owner Type
Purchase Details
Closed on
Oct 14, 2019
Sold by
Vantage Homes Llc
Bought by
Pluto Properties Llc
Current Estimated Value
Home Financials for this Owner
Home Financials are based on the most recent Mortgage that was taken out on this home.
Original Mortgage
$1,068,750
Outstanding Balance
$955,282
Interest Rate
4%
Mortgage Type
New Conventional
Estimated Equity
$1,333,927
Purchase Details
Closed on
Jun 8, 2018
Sold by
Vantage Homes Llc
Bought by
Vantage Homes Llc
Purchase Details
Closed on
Feb 28, 2018
Sold by
Hird Susan L
Bought by
Vantage Homes Llc
Home Financials for this Owner
Home Financials are based on the most recent Mortgage that was taken out on this home.
Original Mortgage
$1,000,000
Interest Rate
4.22%
Mortgage Type
Construction
Purchase Details
Closed on
Mar 4, 2004
Sold by
Bandy Barbara M
Bought by
Bandy Barbara M
Create a Home Valuation Report for This Property
The Home Valuation Report is an in-depth analysis detailing your home's value as well as a comparison with similar homes in the area
Home Values in the Area
Average Home Value in this Area
Purchase History
| Date | Buyer | Sale Price | Title Company |
|---|---|---|---|
| Pluto Properties Llc | -- | Chicago Title Co Glendale | |
| Vantage Homes Llc | -- | Fidelity National Title Co | |
| Vantage Homes Llc | $1,355,000 | Fidelity National Title Co | |
| Bandy Barbara M | -- | -- | |
| Bandy Barbara M | -- | -- | |
| Bandy Wayne E | -- | -- |
Source: Public Records
Mortgage History
| Date | Status | Borrower | Loan Amount |
|---|---|---|---|
| Open | Pluto Properties Llc | $1,068,750 | |
| Previous Owner | Vantage Homes Llc | $1,000,000 |
Source: Public Records
Tax History Compared to Growth
Tax History
| Year | Tax Paid | Tax Assessment Tax Assessment Total Assessment is a certain percentage of the fair market value that is determined by local assessors to be the total taxable value of land and additions on the property. | Land | Improvement |
|---|---|---|---|---|
| 2024 | $17,393 | $1,511,525 | $1,442,145 | $69,380 |
| 2023 | $17,005 | $1,481,888 | $1,413,868 | $68,020 |
| 2022 | $16,718 | $1,452,832 | $1,386,145 | $66,687 |
| 2021 | $16,413 | $1,424,346 | $1,358,966 | $65,380 |
| 2020 | $16,261 | $1,409,742 | $1,345,032 | $64,710 |
| 2019 | $15,026 | $1,382,100 | $1,318,658 | $63,442 |
| 2018 | $1,603 | $1,355,000 | $1,298,618 | $56,382 |
| 2017 | $1,504 | $103,881 | $64,865 | $39,016 |
| 2016 | $1,473 | $101,845 | $63,594 | $38,251 |
| 2015 | $1,455 | $100,316 | $62,639 | $37,677 |
| 2014 | $1,421 | $98,351 | $61,412 | $36,939 |
Source: Public Records
Map
Nearby Homes
- 207 28th St
- 110 30th St
- 2710 W Oceanfront
- 117 25th St
- 2410 Newport Blvd
- 411 30th St
- 3012 W Oceanfront
- 215 32nd St
- 106 33rd St
- 700 Lido Park Dr Unit 13
- 4 Bolivar St
- 601 Lido Park Dr Unit 3F
- 615 Lido Park Dr
- 312 35th St
- 117 35th St
- 41 Channel Rd
- 3322 Via Lido
- 3312 Via Lido
- 27 Bolivar St
- 37 El Paseo St
- 201 28th St Unit 2
- 201 28th St
- 203 28th St
- 205 28th St Unit 1/2
- 205 28th St
- 209 28th St Unit B
- 209 28th St
- 200 29th St
- 202 29th St Unit B
- 202 29th St Unit A
- 202 29th St
- 211 28th St
- 204 1/2 29th St
- 204 29th St
- 2801 W Balboa Blvd
- 2805 W Balboa Blvd
- 206 29th St Unit B
- 206 29th St Unit A
- 206 29th St
- 213 28th St Unit B