Estimated Value: $787,052
Studio
--
Bath
7,500
Sq Ft
$105/Sq Ft
Est. Value
About This Home
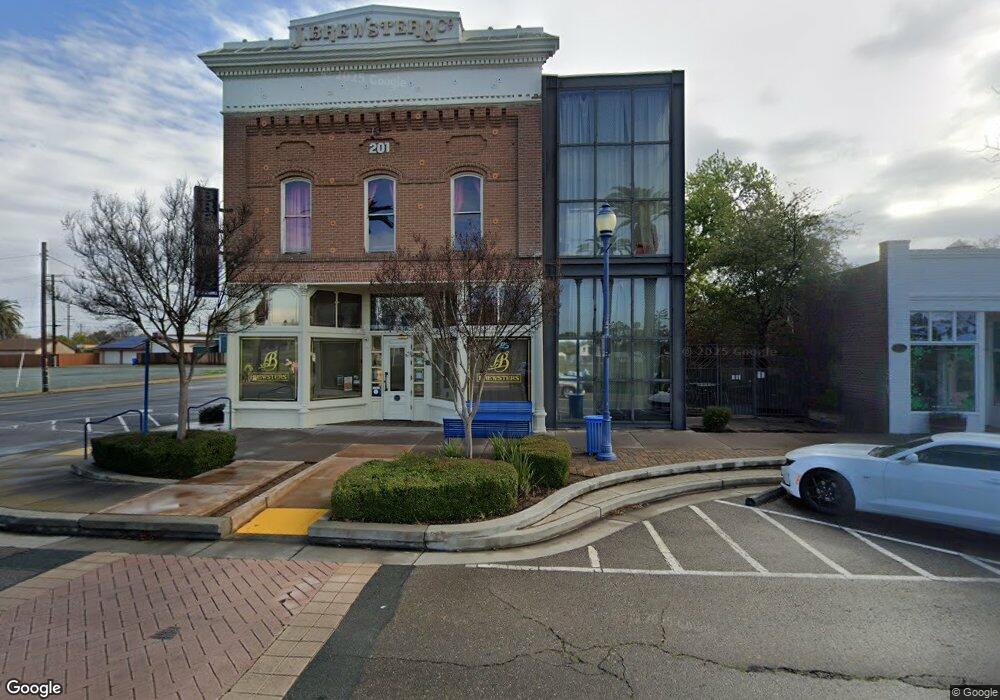
This home is located at 201 4th St, Galt, CA 95632 and is currently priced at $787,052, approximately $104 per square foot. 201 4th St is a home located in Sacramento County with nearby schools including Valley Oaks Elementary School, Robert L. McCaffrey Middle School, and Galt High School.
Ownership History
Date
Name
Owned For
Owner Type
Purchase Details
Closed on
Mar 14, 2017
Sold by
Heidari Mahmoud
Bought by
D & S Development Inc
Current Estimated Value
Purchase Details
Closed on
Jun 20, 2008
Sold by
Mccabe Bob and The Mc Cabe Group Trust
Bought by
D & S Development Inc
Purchase Details
Closed on
Sep 19, 1996
Sold by
Odd Fellows Hall & Cemetary Assn Of Galt
Bought by
Mccabe Bob and The Mccabe Group Trust
Home Financials for this Owner
Home Financials are based on the most recent Mortgage that was taken out on this home.
Original Mortgage
$30,000
Interest Rate
7.87%
Purchase Details
Closed on
Sep 18, 1996
Sold by
Independent Order Of Odd Fellows Of The
Bought by
Mccabe Bob and The Mccabe Group Trust
Home Financials for this Owner
Home Financials are based on the most recent Mortgage that was taken out on this home.
Original Mortgage
$30,000
Interest Rate
7.87%
Purchase Details
Closed on
Feb 5, 1996
Sold by
Grand Lodge Independent Order Of Odd Fel
Bought by
Mccabe Bob and The Mccabe Group Trust
Purchase Details
Closed on
Apr 4, 1995
Sold by
Phoenix Lodge No 239
Bought by
Lodi Lodge #259 Of Lodi
Create a Home Valuation Report for This Property
The Home Valuation Report is an in-depth analysis detailing your home's value as well as a comparison with similar homes in the area
Home Values in the Area
Average Home Value in this Area
Purchase History
| Date | Buyer | Sale Price | Title Company |
|---|---|---|---|
| D & S Development Inc | -- | None Available | |
| D & S Development Inc | -- | Placer Title Company | |
| Mccabe Bob | $40,000 | Chicago Title Co | |
| Mccabe Bob | -- | Chicago Title Co | |
| Mccabe Bob | -- | Chicago Title | |
| Lodi Lodge #259 Of Lodi | -- | -- |
Source: Public Records
Mortgage History
| Date | Status | Borrower | Loan Amount |
|---|---|---|---|
| Previous Owner | Mccabe Bob | $30,000 |
Source: Public Records
Tax History
| Year | Tax Paid | Tax Assessment Tax Assessment Total Assessment is a certain percentage of the fair market value that is determined by local assessors to be the total taxable value of land and additions on the property. | Land | Improvement |
|---|---|---|---|---|
| 2025 | $11,495 | $1,044,522 | $301,749 | $742,773 |
| 2024 | $11,495 | $1,024,042 | $295,833 | $728,209 |
| 2023 | $11,302 | $1,003,964 | $290,033 | $713,931 |
| 2022 | $10,846 | $984,280 | $284,347 | $699,933 |
| 2021 | $10,859 | $964,981 | $278,772 | $686,209 |
| 2020 | $10,768 | $955,087 | $275,914 | $679,173 |
| 2019 | $10,501 | $936,360 | $270,504 | $665,856 |
| 2018 | $10,485 | $918,000 | $265,200 | $652,800 |
| 2017 | $10,074 | $900,000 | $260,000 | $640,000 |
| 2016 | $14,352 | $1,308,269 | $221,912 | $1,086,357 |
| 2015 | $13,858 | $1,288,618 | $218,579 | $1,070,039 |
| 2014 | $10,285 | $1,263,377 | $214,298 | $1,049,079 |
Source: Public Records
Map
Nearby Homes
Your Personal Tour Guide
Ask me questions while you tour the home.