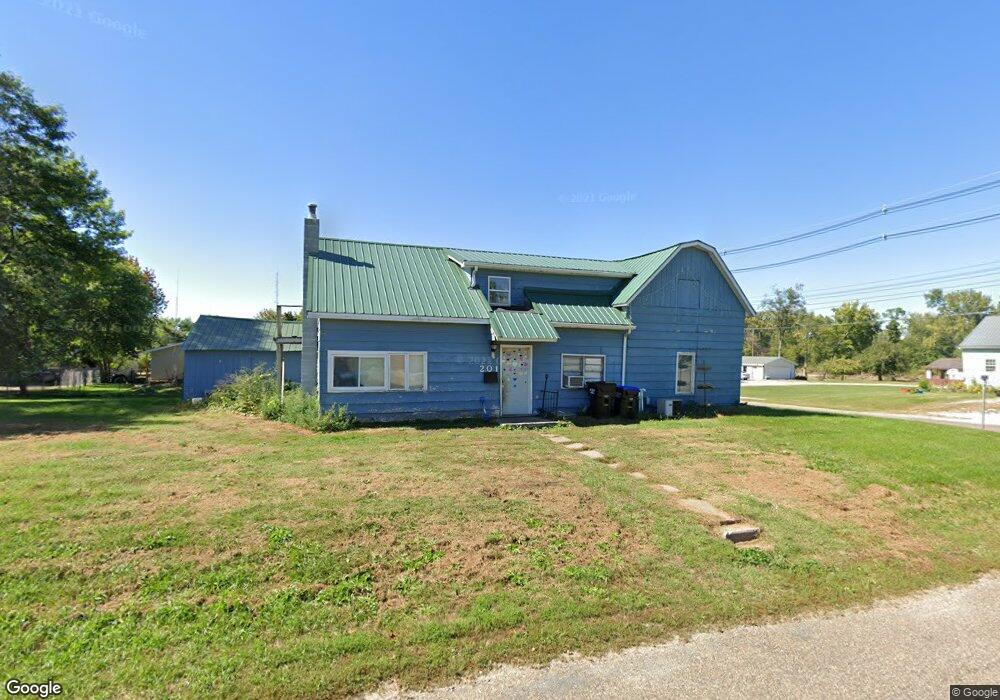
201 5th Ave Vinton, IA 52349
Estimated Value: $101,219 - $166,000
3
Beds
1
Bath
1,436
Sq Ft
$94/Sq Ft
Est. Value
About This Home
This home is located at 201 5th Ave, Vinton, IA 52349 and is currently estimated at $134,305, approximately $93 per square foot. 201 5th Ave is a home with nearby schools including Tilford Elementary School, Vinton-Shellsburg Middle School, and Vinton-Shellsburg High School.
Ownership History
Date
Name
Owned For
Owner Type
Purchase Details
Closed on
Sep 16, 2022
Sold by
Enos Christopher M and Enos Kari
Bought by
Wright David Russell
Current Estimated Value
Home Financials for this Owner
Home Financials are based on the most recent Mortgage that was taken out on this home.
Original Mortgage
$153,989
Outstanding Balance
$146,806
Interest Rate
4.99%
Mortgage Type
New Conventional
Estimated Equity
-$12,501
Purchase Details
Closed on
Apr 15, 2005
Sold by
Stufflebeam Harold Kent and Stufflebeam Norma Colleen
Bought by
Schwenker Lee A and Schwenker Julie M
Create a Home Valuation Report for This Property
The Home Valuation Report is an in-depth analysis detailing your home's value as well as a comparison with similar homes in the area
Home Values in the Area
Average Home Value in this Area
Purchase History
| Date | Buyer | Sale Price | Title Company |
|---|---|---|---|
| Wright David Russell | $100,000 | -- | |
| Schwenker Lee A | $76,500 | None Available |
Source: Public Records
Mortgage History
| Date | Status | Borrower | Loan Amount |
|---|---|---|---|
| Open | Wright David Russell | $153,989 |
Source: Public Records
Tax History
| Year | Tax Paid | Tax Assessment Tax Assessment Total Assessment is a certain percentage of the fair market value that is determined by local assessors to be the total taxable value of land and additions on the property. | Land | Improvement |
|---|---|---|---|---|
| 2025 | $1,094 | $64,200 | $15,500 | $48,700 |
| 2024 | $1,094 | $58,400 | $14,900 | $43,500 |
| 2023 | $1,016 | $58,400 | $14,900 | $43,500 |
| 2022 | $1,042 | $47,200 | $11,900 | $35,300 |
| 2021 | $1,042 | $47,200 | $11,900 | $35,300 |
| 2020 | $658 | $30,400 | $9,200 | $21,200 |
| 2019 | $808 | $30,400 | $9,200 | $21,200 |
| 2018 | $786 | $36,900 | $8,500 | $28,400 |
| 2017 | $786 | $36,900 | $8,500 | $28,400 |
| 2016 | $742 | $34,400 | $7,900 | $26,500 |
| 2015 | $742 | $34,400 | $7,900 | $26,500 |
| 2014 | $814 | $37,600 | $0 | $0 |
Source: Public Records
Map
Nearby Homes
Your Personal Tour Guide
Ask me questions while you tour the home.