Estimated Value: $283,000 - $366,000
4
Beds
2
Baths
1,400
Sq Ft
$226/Sq Ft
Est. Value
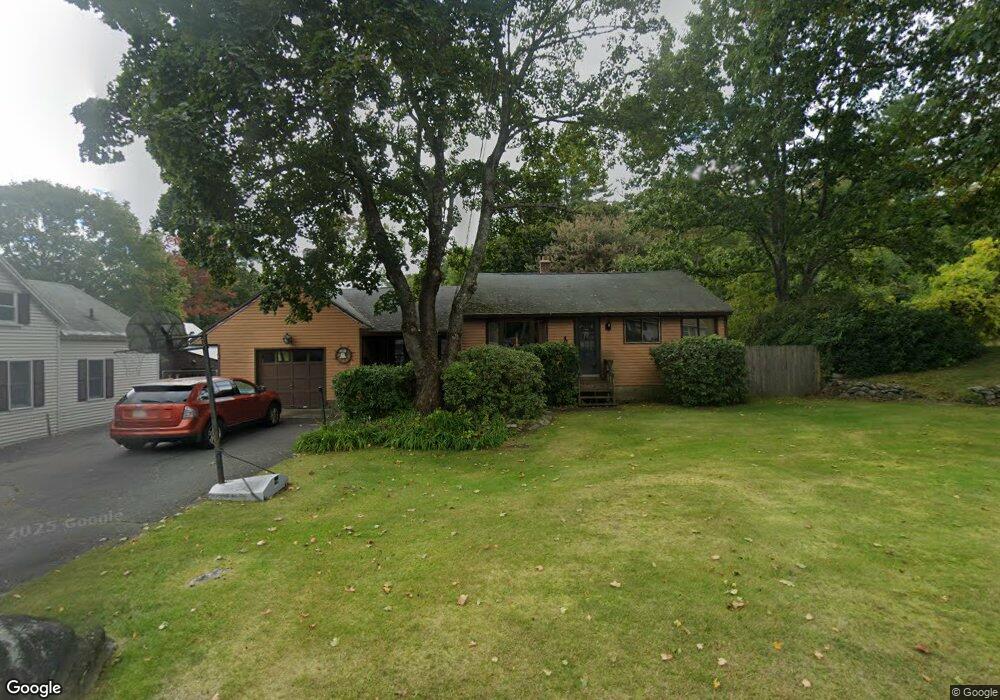
About This Home
This home is located at 201 Bryant St, Athol, MA 01331 and is currently estimated at $316,270, approximately $225 per square foot. 201 Bryant St is a home located in Worcester County with nearby schools including Athol High School.
Ownership History
Date
Name
Owned For
Owner Type
Purchase Details
Closed on
Jun 29, 2015
Sold by
Nelson Joseph E and Robertson Stephany A
Bought by
Robertson Robert
Current Estimated Value
Home Financials for this Owner
Home Financials are based on the most recent Mortgage that was taken out on this home.
Original Mortgage
$119,387
Outstanding Balance
$91,711
Interest Rate
3.84%
Mortgage Type
New Conventional
Estimated Equity
$224,559
Purchase Details
Closed on
Dec 14, 2001
Sold by
Bergquist James C and Berquist Elizabeth J
Bought by
Nelson Joseph E
Home Financials for this Owner
Home Financials are based on the most recent Mortgage that was taken out on this home.
Original Mortgage
$103,276
Interest Rate
6.6%
Mortgage Type
Purchase Money Mortgage
Create a Home Valuation Report for This Property
The Home Valuation Report is an in-depth analysis detailing your home's value as well as a comparison with similar homes in the area
Home Values in the Area
Average Home Value in this Area
Purchase History
| Date | Buyer | Sale Price | Title Company |
|---|---|---|---|
| Robertson Robert | $117,000 | -- | |
| Nelson Joseph E | $105,000 | -- |
Source: Public Records
Mortgage History
| Date | Status | Borrower | Loan Amount |
|---|---|---|---|
| Open | Robertson Robert | $119,387 | |
| Previous Owner | Nelson Joseph E | $108,850 | |
| Previous Owner | Nelson Joseph E | $103,276 | |
| Previous Owner | Nelson Joseph E | $60,000 |
Source: Public Records
Tax History
| Year | Tax Paid | Tax Assessment Tax Assessment Total Assessment is a certain percentage of the fair market value that is determined by local assessors to be the total taxable value of land and additions on the property. | Land | Improvement |
|---|---|---|---|---|
| 2025 | $3,331 | $262,100 | $57,700 | $204,400 |
| 2024 | $3,197 | $249,200 | $57,700 | $191,500 |
| 2023 | $3,028 | $215,700 | $41,800 | $173,900 |
| 2022 | $2,936 | $182,900 | $39,800 | $143,100 |
| 2021 | $2,940 | $166,500 | $36,200 | $130,300 |
| 2020 | $2,780 | $161,800 | $32,900 | $128,900 |
| 2019 | $2,523 | $144,600 | $29,300 | $115,300 |
| 2018 | $2,575 | $131,600 | $26,700 | $104,900 |
| 2017 | $2,358 | $115,600 | $26,700 | $88,900 |
| 2016 | $2,177 | $109,800 | $26,700 | $83,100 |
Source: Public Records
Map
Nearby Homes
Your Personal Tour Guide
Ask me questions while you tour the home.