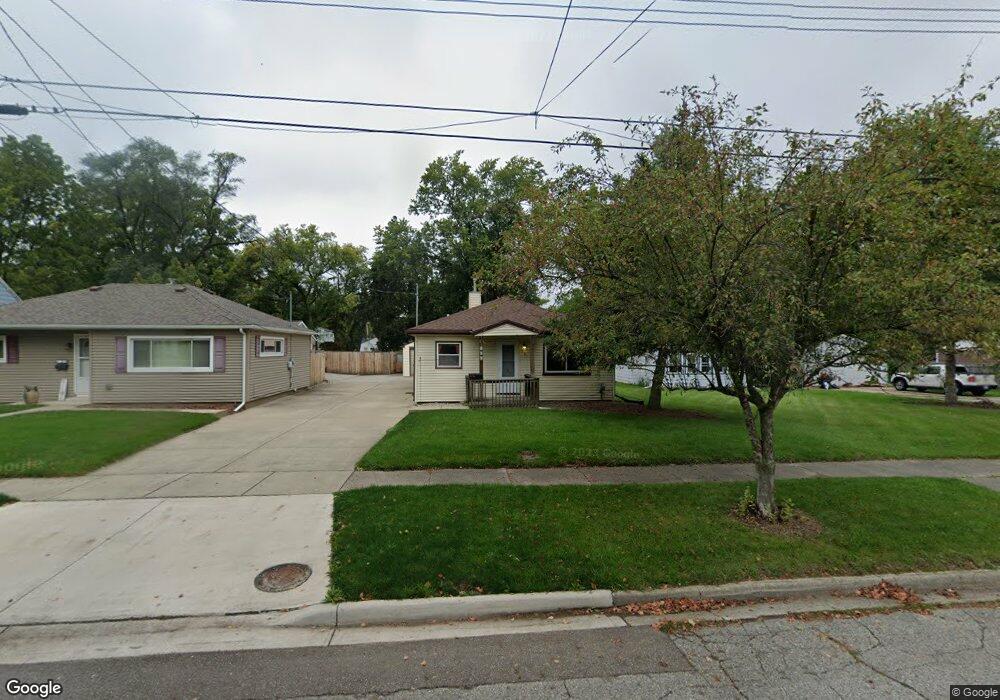
201 Cox Blvd Lansing, MI 48910
Old Everett NeighborhoodEstimated Value: $107,117 - $131,000
3
Beds
1
Bath
988
Sq Ft
$121/Sq Ft
Est. Value
About This Home
This home is located at 201 Cox Blvd, Lansing, MI 48910 and is currently estimated at $119,529, approximately $120 per square foot. 201 Cox Blvd is a home located in Ingham County with nearby schools including Kendon School, Attwood School, and Everett High School.
Ownership History
Date
Name
Owned For
Owner Type
Purchase Details
Closed on
Jun 11, 2021
Sold by
Walker Kimberly A and Rupright Kimberly A
Bought by
Rupright Joshua P
Current Estimated Value
Home Financials for this Owner
Home Financials are based on the most recent Mortgage that was taken out on this home.
Original Mortgage
$63,100
Outstanding Balance
$57,129
Interest Rate
2.9%
Mortgage Type
New Conventional
Estimated Equity
$62,400
Purchase Details
Closed on
Mar 22, 2004
Sold by
Rupright Joshua P
Bought by
Rupright Joshua P and Rupright Kimberly A
Home Financials for this Owner
Home Financials are based on the most recent Mortgage that was taken out on this home.
Original Mortgage
$18,000
Interest Rate
5.74%
Mortgage Type
Stand Alone Refi Refinance Of Original Loan
Purchase Details
Closed on
May 30, 1997
Sold by
Gates Clarence W
Bought by
Rupright Joshua P
Create a Home Valuation Report for This Property
The Home Valuation Report is an in-depth analysis detailing your home's value as well as a comparison with similar homes in the area
Home Values in the Area
Average Home Value in this Area
Purchase History
| Date | Buyer | Sale Price | Title Company |
|---|---|---|---|
| Rupright Joshua P | -- | Liberty Title | |
| Rupright Joshua P | -- | -- | |
| Rupright Joshua P | $51,900 | -- |
Source: Public Records
Mortgage History
| Date | Status | Borrower | Loan Amount |
|---|---|---|---|
| Open | Rupright Joshua P | $63,100 | |
| Closed | Rupright Joshua P | $18,000 |
Source: Public Records
Tax History
| Year | Tax Paid | Tax Assessment Tax Assessment Total Assessment is a certain percentage of the fair market value that is determined by local assessors to be the total taxable value of land and additions on the property. | Land | Improvement |
|---|---|---|---|---|
| 2025 | $1,963 | $53,400 | $6,900 | $46,500 |
| 2024 | $15 | $43,600 | $6,900 | $36,700 |
| 2023 | $1,842 | $39,800 | $6,900 | $32,900 |
| 2022 | $1,664 | $33,900 | $6,300 | $27,600 |
| 2021 | $1,630 | $31,300 | $3,700 | $27,600 |
| 2020 | $1,584 | $29,200 | $3,700 | $25,500 |
| 2019 | $1,516 | $28,300 | $3,700 | $24,600 |
| 2018 | $1,423 | $25,000 | $3,700 | $21,300 |
| 2017 | $1,362 | $25,000 | $3,700 | $21,300 |
| 2016 | $2,356 | $23,600 | $3,700 | $19,900 |
| 2015 | $2,356 | $22,800 | $7,469 | $15,331 |
| 2014 | $2,356 | $22,600 | $4,668 | $17,932 |
Source: Public Records
Map
Nearby Homes
- 201 E Syringa Dr
- 111 E Potter Ave
- 205 E Jolly Rd Unit 6
- 5009 Kessler Dr
- 522 E Cavanaugh Rd
- 4022 Stabler St
- 600 E Cavanaugh Rd
- 4731 Palmer St
- 601 Jessop Ave
- 419 W Jolly Rd
- 600 W Cavanaugh Rd
- 5008 Southgate Ave
- 709 Jessop Ave
- 4125 Lowcroft Ave
- 817 Jessop Ave
- 3723 Weger Place
- 810 Fenton St
- 4926 Burchfield Ave
- 0 Glenwood Ave
- 125 E Northrup St
Your Personal Tour Guide
Ask me questions while you tour the home.