Estimated Value: $205,000 - $314,000
3
Beds
1
Bath
1,464
Sq Ft
$191/Sq Ft
Est. Value
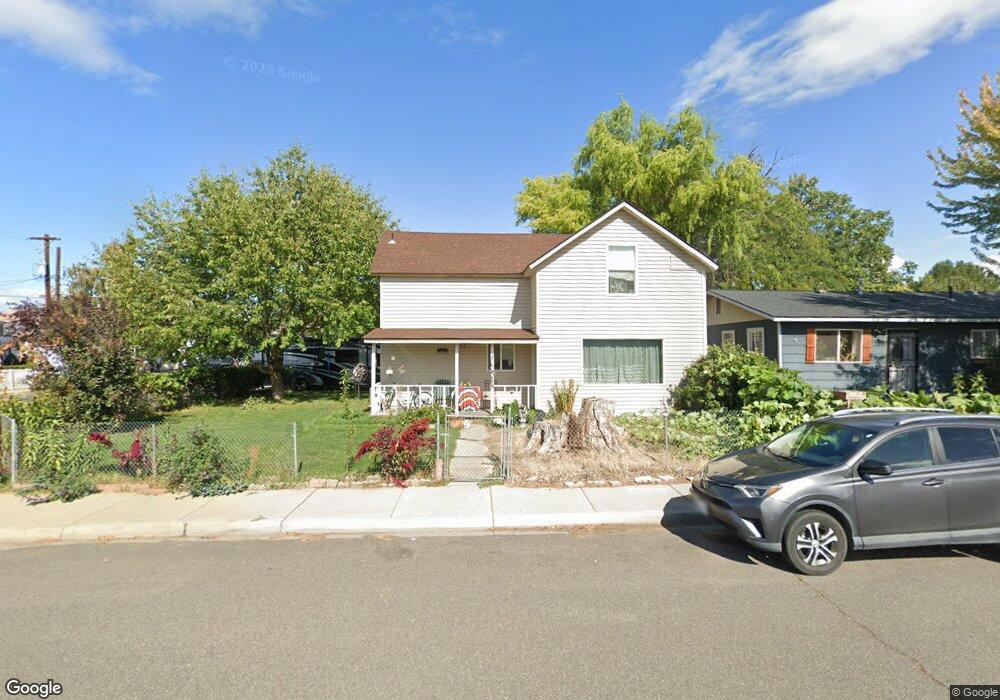
About This Home
This home is located at 201 E Naches Ave, Moxee, WA 98936 and is currently estimated at $278,928, approximately $190 per square foot. 201 E Naches Ave is a home located in Yakima County with nearby schools including East Valley High School.
Ownership History
Date
Name
Owned For
Owner Type
Purchase Details
Closed on
Feb 23, 2007
Sold by
Mendoza Audel and Mendoza Nori A
Bought by
Rainford Michael W and Rainford Teresa A
Current Estimated Value
Home Financials for this Owner
Home Financials are based on the most recent Mortgage that was taken out on this home.
Original Mortgage
$23,600
Interest Rate
6.21%
Mortgage Type
Stand Alone Second
Purchase Details
Closed on
Mar 1, 2006
Sold by
Federal National Mortgage Association
Bought by
Mendoza Audel
Purchase Details
Closed on
Nov 18, 2005
Sold by
Turner Rhonda L
Bought by
Federal National Mortgage Association
Purchase Details
Closed on
Aug 11, 2004
Sold by
Ashby Virginia C
Bought by
Turner Rhonda L
Home Financials for this Owner
Home Financials are based on the most recent Mortgage that was taken out on this home.
Original Mortgage
$85,000
Interest Rate
6.17%
Mortgage Type
Unknown
Create a Home Valuation Report for This Property
The Home Valuation Report is an in-depth analysis detailing your home's value as well as a comparison with similar homes in the area
Home Values in the Area
Average Home Value in this Area
Purchase History
| Date | Buyer | Sale Price | Title Company |
|---|---|---|---|
| Rainford Michael W | $118,000 | Schreiner Title Company | |
| Mendoza Audel | $70,000 | First American Title Comp | |
| Federal National Mortgage Association | $327 | First American Title Comp | |
| Turner Rhonda L | $85,000 | Fidelity Title Company |
Source: Public Records
Mortgage History
| Date | Status | Borrower | Loan Amount |
|---|---|---|---|
| Closed | Rainford Michael W | $23,600 | |
| Previous Owner | Turner Rhonda L | $85,000 |
Source: Public Records
Tax History
| Year | Tax Paid | Tax Assessment Tax Assessment Total Assessment is a certain percentage of the fair market value that is determined by local assessors to be the total taxable value of land and additions on the property. | Land | Improvement |
|---|---|---|---|---|
| 2025 | $3,201 | $306,000 | $58,500 | $247,500 |
| 2023 | $3,035 | $216,800 | $33,400 | $183,400 |
| 2022 | $2,541 | $196,900 | $33,400 | $163,500 |
| 2021 | $2,412 | $172,500 | $33,400 | $139,100 |
| 2019 | $1,884 | $136,800 | $33,400 | $103,400 |
| 2018 | $843 | $51,200 | $33,400 | $17,800 |
| 2017 | $1,436 | $101,000 | $33,400 | $67,600 |
| 2016 | $1,511 | $101,000 | $33,500 | $67,500 |
| 2015 | $1,511 | $103,000 | $33,500 | $69,500 |
| 2014 | $1,511 | $104,100 | $33,500 | $70,600 |
| 2013 | $1,511 | $104,100 | $33,500 | $70,600 |
Source: Public Records
Map
Nearby Homes
- NKA Rivard Rd
- 204 Clemans Ave
- 519 Lacoursiere St
- 8711 Postma Rd
- 104 Bravo St
- 514 Cascade Ave
- 107 Palisade St
- 7800 Postma Rd
- 505 Faucher Rd
- NKA High Point Landing
- 2206 Porter Loop
- 461 White Rd
- NKA Birchfield Rd
- NKA E Norman Rd
- 100 Orchard Rd
- 1291 E Norman Rd
- 312 Wendt Rd
- 230 S Clark Heights Rd
- 2709 Riverside Rd
- NKA Riverside Rd
- 203 E Naches Ave
- 205 E Naches Ave
- 202 E Naches Ave
- 209 E Naches Ave
- 204 E Naches Ave
- 202 E Charron Rd
- 105 E Naches Ave
- 206 E Naches Ave
- 117 E Charron Rd
- 208 E Naches Ave
- 211 E Naches Ave
- 201 E Charron Rd
- 106 E Naches Ave
- 204 E Charron Rd
- 210 E Naches Ave
- 213 E Naches Ave
- 104 E Naches Ave
- 115 E Charron Rd
- 119 E Charron Rd
- 212 E Naches Ave
Your Personal Tour Guide
Ask me questions while you tour the home.