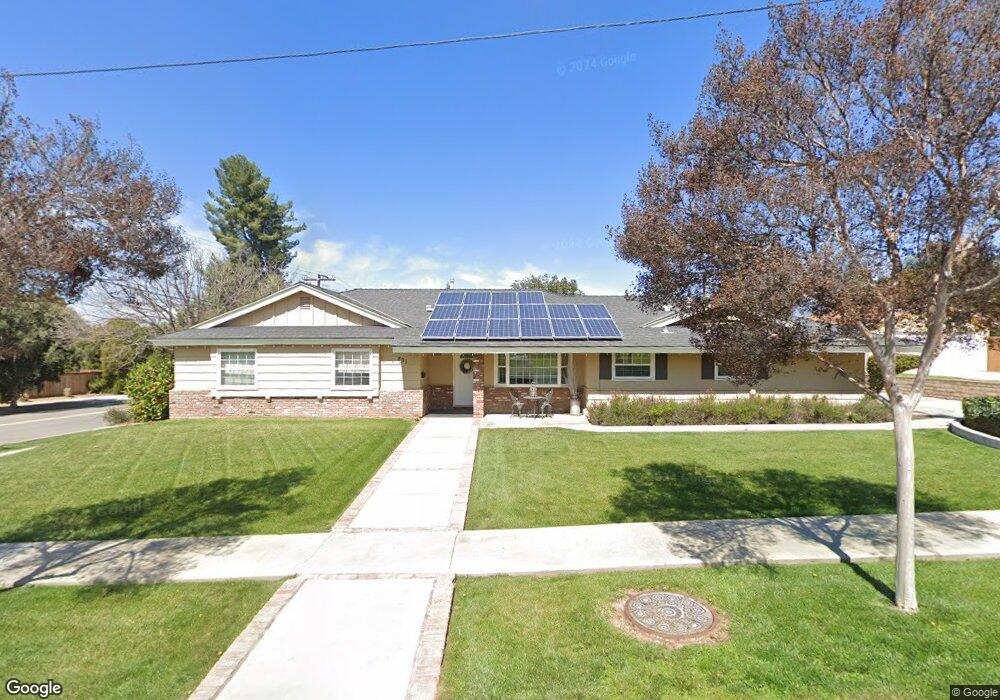
201 E South Ave Redlands, CA 92373
South Redlands NeighborhoodEstimated Value: $720,674 - $817,000
4
Beds
2
Baths
2,007
Sq Ft
$385/Sq Ft
Est. Value
About This Home
This home is located at 201 E South Ave, Redlands, CA 92373 and is currently estimated at $772,669, approximately $384 per square foot. 201 E South Ave is a home located in San Bernardino County with nearby schools including Kimberly Elementary School, Moore Middle School, and Redlands Senior High School.
Ownership History
Date
Name
Owned For
Owner Type
Purchase Details
Closed on
Dec 28, 2015
Sold by
Laskowicz David Edward
Bought by
Laskowicz Family Trust
Current Estimated Value
Purchase Details
Closed on
Jul 8, 1998
Sold by
Lemmons Ronald and Lemmons Barbara J
Bought by
Laskowicz Dave and Laskowicz Mary Jo
Home Financials for this Owner
Home Financials are based on the most recent Mortgage that was taken out on this home.
Original Mortgage
$164,800
Interest Rate
6.91%
Mortgage Type
VA
Create a Home Valuation Report for This Property
The Home Valuation Report is an in-depth analysis detailing your home's value as well as a comparison with similar homes in the area
Home Values in the Area
Average Home Value in this Area
Purchase History
| Date | Buyer | Sale Price | Title Company |
|---|---|---|---|
| Laskowicz Family Trust | -- | None Available | |
| Laskowicz Dave | $158,000 | Old Republic Title Company |
Source: Public Records
Mortgage History
| Date | Status | Borrower | Loan Amount |
|---|---|---|---|
| Previous Owner | Laskowicz Dave | $164,800 |
Source: Public Records
Tax History Compared to Growth
Tax History
| Year | Tax Paid | Tax Assessment Tax Assessment Total Assessment is a certain percentage of the fair market value that is determined by local assessors to be the total taxable value of land and additions on the property. | Land | Improvement |
|---|---|---|---|---|
| 2025 | $2,852 | $250,836 | $94,063 | $156,773 |
| 2024 | $2,852 | $245,918 | $92,219 | $153,699 |
| 2023 | $2,847 | $241,096 | $90,411 | $150,685 |
| 2022 | $2,805 | $236,368 | $88,638 | $147,730 |
| 2021 | $2,854 | $231,733 | $86,900 | $144,833 |
| 2020 | $2,811 | $229,357 | $86,009 | $143,348 |
| 2019 | $2,731 | $224,860 | $84,323 | $140,537 |
| 2018 | $2,662 | $220,451 | $82,670 | $137,781 |
| 2017 | $2,638 | $216,128 | $81,049 | $135,079 |
| 2016 | $2,607 | $211,890 | $79,460 | $132,430 |
| 2015 | $2,586 | $208,707 | $78,266 | $130,441 |
| 2014 | $2,556 | $204,619 | $76,733 | $127,886 |
Source: Public Records
Map
Nearby Homes
- 1525 Lynne Ct
- 225 Sunset Dr
- 375 Franklin Ave
- 1517 Pamela Crest
- 1435 Patricia Dr
- 0 Garden St Unit EV23054640
- 1627 Halsey St
- 435 Marilyn Ln
- 120 Franklin Ave
- 446 E Sunset Dr N
- 512 Golden Dr W
- 505 E Sunset Dr N
- 419 Marcia St
- 0 Ford St
- 1515 Elizabeth St
- 533 Via Vista Dr
- 1702 Dwight St
- 1705 Rossmont Dr
- 612 Golden Dr W
- 608 Via Vista Dr
- 205 E South Ave
- 202 Belmont Ct
- 206 Belmont Ct
- 129 E South Ave
- 1503 Franklin Ave
- 204 E South Ave
- 209 E South Ave
- 140 Belmont Ct
- 208 E South Ave
- 210 Belmont Ct
- 130 E South Ave
- 127 E South Ave
- 1513 Franklin Ave
- 138 Belmont Ct
- 212 E South Ave
- 213 E South Ave
- 203 Belmont Ct
- 1508 Franklin Ave
- 207 Belmont Ct
- 214 Belmont Ct