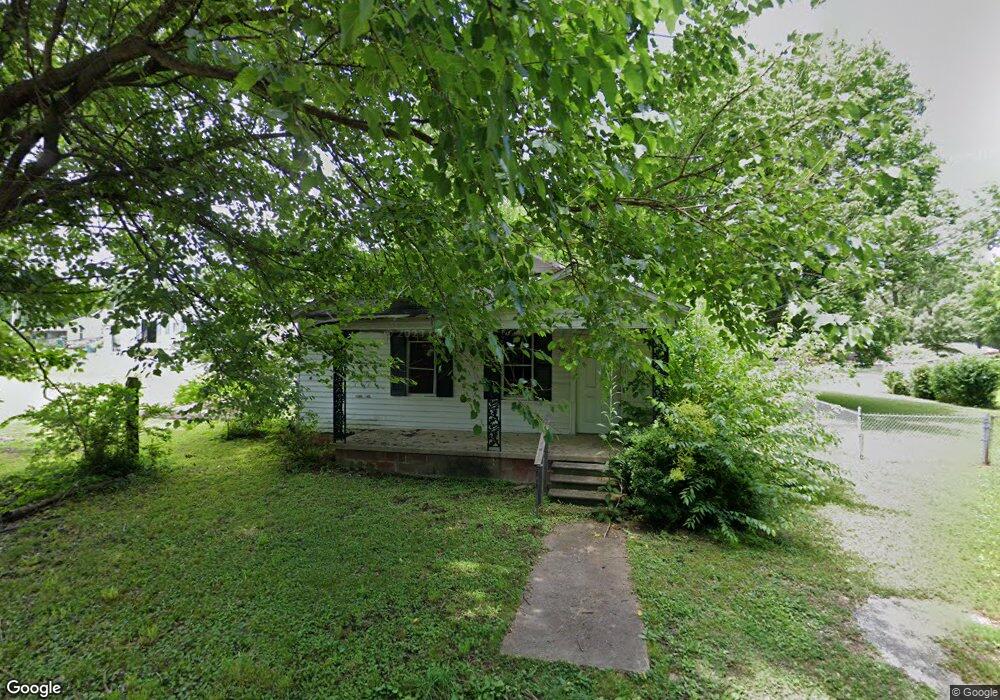
201 Faris St Jackson, TN 38301
Estimated Value: $52,000 - $131,275
2
Beds
1
Bath
1,040
Sq Ft
$95/Sq Ft
Est. Value
About This Home
This home is located at 201 Faris St, Jackson, TN 38301 and is currently estimated at $98,819, approximately $95 per square foot. 201 Faris St is a home located in Madison County with nearby schools including Lincoln Elementary School, North Parkway Middle School, and Liberty Technology Magnet High School.
Ownership History
Date
Name
Owned For
Owner Type
Purchase Details
Closed on
Aug 28, 2024
Sold by
Debs Properties Llc
Bought by
Fields Roy J
Current Estimated Value
Home Financials for this Owner
Home Financials are based on the most recent Mortgage that was taken out on this home.
Original Mortgage
$193,500
Outstanding Balance
$190,910
Interest Rate
6.77%
Mortgage Type
Seller Take Back
Estimated Equity
-$92,091
Purchase Details
Closed on
Jul 21, 2023
Sold by
Goodman Jimmy and Goodman Carman
Bought by
Fields Bruce
Home Financials for this Owner
Home Financials are based on the most recent Mortgage that was taken out on this home.
Original Mortgage
$152,000
Interest Rate
6.71%
Mortgage Type
Seller Take Back
Purchase Details
Closed on
Dec 9, 2019
Sold by
County Of Madison
Bought by
Goodman Jimmy
Purchase Details
Closed on
May 19, 2008
Sold by
Collins Edna C
Bought by
Gray Tony D
Purchase Details
Closed on
Dec 4, 1967
Bought by
Collins Edna C
Create a Home Valuation Report for This Property
The Home Valuation Report is an in-depth analysis detailing your home's value as well as a comparison with similar homes in the area
Purchase History
| Date | Buyer | Sale Price | Title Company |
|---|---|---|---|
| Fields Roy J | $200,000 | Pillar Title And Escrow Llc | |
| Debs Properties Llc | -- | Pillar Title And Escrow Llc | |
| Fields Bruce | $190,000 | None Listed On Document | |
| Goodman Jimmy | $3,613 | None Available | |
| Gray Tony D | -- | -- | |
| Collins Edna C | -- | -- |
Source: Public Records
Mortgage History
| Date | Status | Borrower | Loan Amount |
|---|---|---|---|
| Open | Fields Roy J | $193,500 | |
| Previous Owner | Fields Bruce | $152,000 |
Source: Public Records
Tax History
| Year | Tax Paid | Tax Assessment Tax Assessment Total Assessment is a certain percentage of the fair market value that is determined by local assessors to be the total taxable value of land and additions on the property. | Land | Improvement |
|---|---|---|---|---|
| 2025 | $99 | $5,275 | $900 | $4,375 |
| 2024 | $99 | $5,275 | $900 | $4,375 |
| 2022 | $184 | $5,275 | $900 | $4,375 |
| 2021 | $181 | $4,200 | $800 | $3,400 |
| 2020 | $181 | $4,200 | $800 | $3,400 |
| 2019 | $181 | $4,200 | $800 | $3,400 |
| 2018 | $181 | $4,200 | $800 | $3,400 |
| 2017 | $332 | $7,525 | $800 | $6,725 |
| 2016 | $310 | $7,525 | $800 | $6,725 |
| 2015 | $309 | $7,525 | $800 | $6,725 |
| 2014 | $309 | $7,525 | $800 | $6,725 |
Source: Public Records
Map
Nearby Homes
Your Personal Tour Guide
Ask me questions while you tour the home.