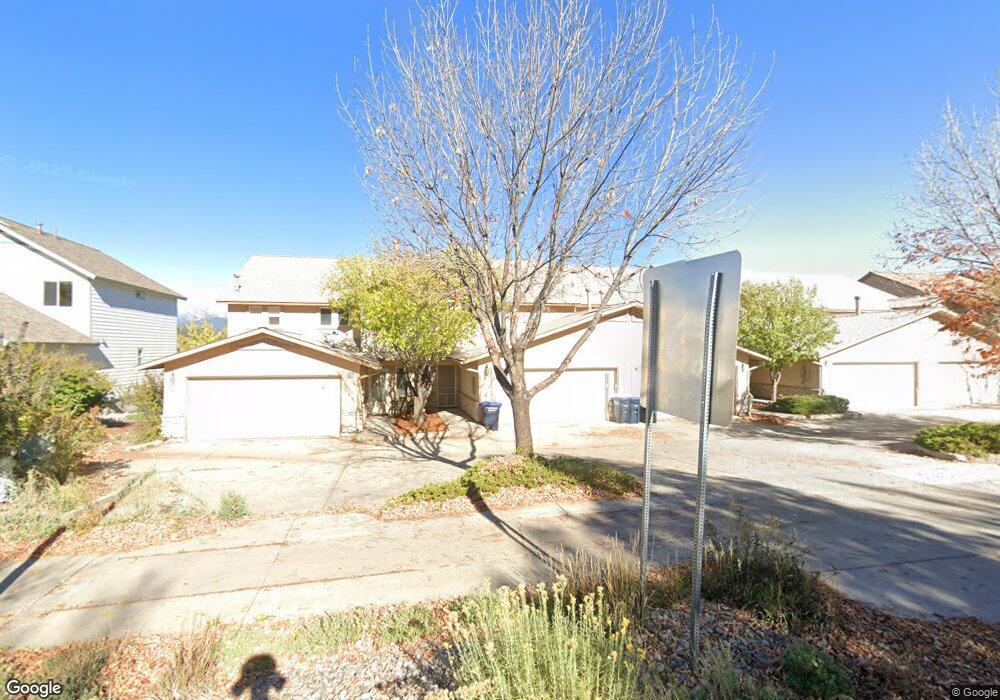
201 Jenkins Ranch Rd Unit D Durango, CO 81301
Skyridge NeighborhoodEstimated Value: $745,000 - $856,000
3
Beds
3
Baths
2,111
Sq Ft
$373/Sq Ft
Est. Value
About This Home
This home is located at 201 Jenkins Ranch Rd Unit D, Durango, CO 81301 and is currently estimated at $786,804, approximately $372 per square foot. 201 Jenkins Ranch Rd Unit D is a home located in La Plata County with nearby schools including Park Elementary School, Escalante Middle School, and Durango High School.
Ownership History
Date
Name
Owned For
Owner Type
Purchase Details
Closed on
Jan 23, 2017
Sold by
Inna J Liaboh
Bought by
Say Al Mee Chang and Decarvalho Luciano
Current Estimated Value
Home Financials for this Owner
Home Financials are based on the most recent Mortgage that was taken out on this home.
Original Mortgage
$304,000
Outstanding Balance
$250,309
Interest Rate
4.09%
Estimated Equity
$536,495
Purchase Details
Closed on
Mar 21, 2014
Sold by
Hurley James F
Bought by
Liaboh Inna
Home Financials for this Owner
Home Financials are based on the most recent Mortgage that was taken out on this home.
Original Mortgage
$268,000
Interest Rate
4.62%
Mortgage Type
Adjustable Rate Mortgage/ARM
Purchase Details
Closed on
Nov 23, 2005
Sold by
Hossain Ziarat and Akhter Rozy
Bought by
Hurley James F
Purchase Details
Closed on
May 25, 2001
Bought by
Chang-Say Ai-Mee A and Decarvalho Lucian
Create a Home Valuation Report for This Property
The Home Valuation Report is an in-depth analysis detailing your home's value as well as a comparison with similar homes in the area
Home Values in the Area
Average Home Value in this Area
Purchase History
| Date | Buyer | Sale Price | Title Company |
|---|---|---|---|
| Say Al Mee Chang | -- | -- | |
| Liaboh Inna | $335,000 | Land Title Guarantee Company | |
| Hurley James F | $389,900 | Colorado Land Title Co | |
| Chang-Say Ai-Mee A | $225,000 | -- |
Source: Public Records
Mortgage History
| Date | Status | Borrower | Loan Amount |
|---|---|---|---|
| Open | Say Al Mee Chang | $304,000 | |
| Closed | Say Al Mee Chang | -- | |
| Previous Owner | Liaboh Inna | $268,000 |
Source: Public Records
Tax History Compared to Growth
Tax History
| Year | Tax Paid | Tax Assessment Tax Assessment Total Assessment is a certain percentage of the fair market value that is determined by local assessors to be the total taxable value of land and additions on the property. | Land | Improvement |
|---|---|---|---|---|
| 2025 | $1,413 | $44,770 | $6,670 | $38,100 |
| 2024 | $1,202 | $29,900 | $5,110 | $24,790 |
| 2023 | $1,202 | $32,900 | $5,630 | $27,270 |
| 2022 | $1,155 | $34,840 | $5,960 | $28,880 |
| 2021 | $1,160 | $29,230 | $4,880 | $24,350 |
| 2020 | $1,083 | $28,160 | $4,750 | $23,410 |
| 2019 | $1,036 | $28,160 | $4,750 | $23,410 |
| 2018 | $995 | $27,400 | $4,520 | $22,880 |
| 2017 | $1,007 | $28,350 | $4,520 | $23,830 |
| 2016 | $969 | $29,740 | $4,740 | $25,000 |
| 2015 | $820 | $29,740 | $4,740 | $25,000 |
| 2014 | $820 | $25,810 | $4,380 | $21,430 |
| 2013 | -- | $25,810 | $4,380 | $21,430 |
Source: Public Records
Map
Nearby Homes
- 1386 Goeglein Gulch Rd
- 1100 Goeglein Gulch Rd Unit 225
- 6 Ferringway Cir Unit 22
- TBD Cedar Ridge Way
- 106 Via Tuscana
- 402 County Road 238
- 112 Tierra Vista Dr
- 760 Goeglein Gulch Rd Unit 4
- 760 Goeglein Gulch Rd Unit 3
- 760 Goeglein Gulch Rd Unit 5
- 760 Goeglein Gulch Rd Unit 6
- 760 Goeglein Gulch Rd Unit 2
- 760 Goeglein Gulch Rd Unit 1
- 762 Goeglein Gulch Rd Unit 2
- 762 Goeglein Gulch Rd Unit 1
- 2278 Tierra Verde Dr
- 716 Obrien Dr Unit 4
- 20 Jenkins Dr
- 711 Florida Rd
- 900 Florida Rd
- 201 Jenkins Ranch Rd Unit 3
- 201 Jenkins Ranch Rd Unit E
- 201 Jenkins Ranch Rd Unit C
- 201 Jenkins Ranch Rd
- 201 Jenkins Ranch Rd Unit A
- 201E Jenkins Ranch Rd
- 1 Molas Dr
- 202 Jenkins Ranch Rd Unit B
- 202 Jenkins Ranch Rd Unit A
- 202 Jenkins Ranch Rd
- 205 Jenkins Ranch Rd Unit E
- 205 Jenkins Ranch Rd Unit D
- 205 Jenkins Ranch Rd Unit C
- 205 Jenkins Ranch Rd Unit B
- 205 Jenkins Ranch Rd Unit A
- 205 Jenkins Ranch Rd Unit A
- 107 Jenkins Ranch Rd Unit F
- 107 Jenkins Ranch Rd Unit E
- 107 Jenkins Ranch Rd Unit D
- 107 Jenkins Ranch Rd Unit C