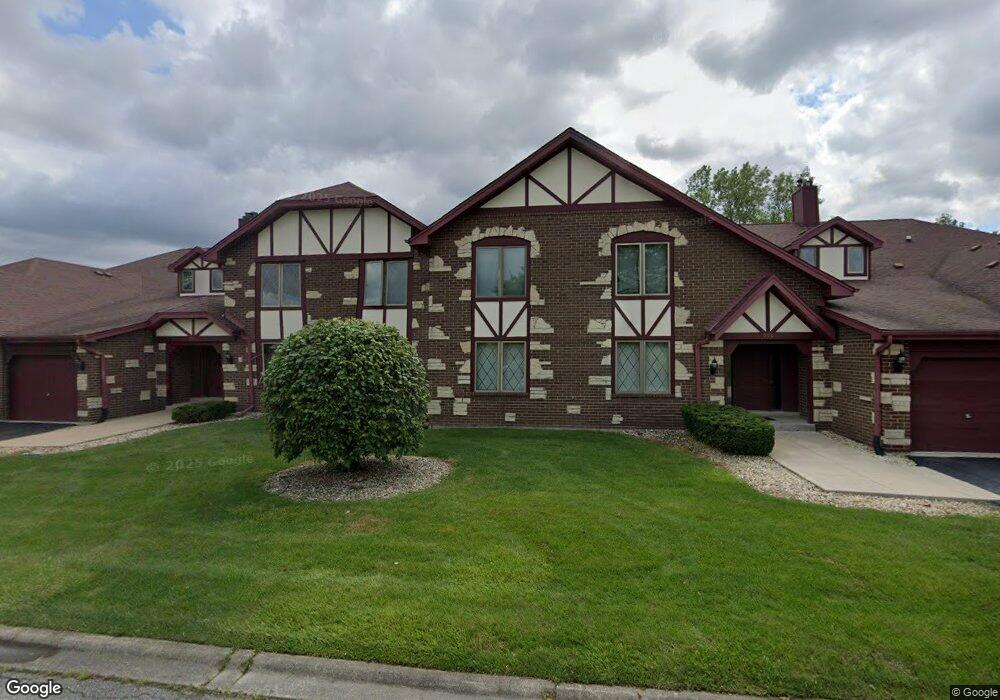
201 Lake Dr Unit 201G4 Olympia Fields, IL 60461
Estimated Value: $156,000 - $319,000
--
Bed
--
Bath
54,220
Sq Ft
$4/Sq Ft
Est. Value
About This Home
This home is located at 201 Lake Dr Unit 201G4, Olympia Fields, IL 60461 and is currently estimated at $240,728, approximately $4 per square foot. 201 Lake Dr Unit 201G4 is a home located in Cook County with nearby schools including Illinois School, Arcadia Elementary School, and Indiana Elementary School.
Ownership History
Date
Name
Owned For
Owner Type
Purchase Details
Closed on
Feb 8, 2019
Sold by
Rayburn Joann Cory
Bought by
Medcalf Rochelle
Current Estimated Value
Home Financials for this Owner
Home Financials are based on the most recent Mortgage that was taken out on this home.
Original Mortgage
$109,200
Outstanding Balance
$96,487
Interest Rate
4.75%
Mortgage Type
New Conventional
Estimated Equity
$144,241
Purchase Details
Closed on
Nov 10, 1998
Sold by
Albert Lucille L
Bought by
Rayburn Joann Cory
Home Financials for this Owner
Home Financials are based on the most recent Mortgage that was taken out on this home.
Original Mortgage
$131,150
Interest Rate
6.96%
Mortgage Type
FHA
Purchase Details
Closed on
Jul 15, 1994
Sold by
Rasmussen Liloree M and Mcgree Jean M
Bought by
Pallone Elizabeth
Home Financials for this Owner
Home Financials are based on the most recent Mortgage that was taken out on this home.
Original Mortgage
$96,900
Interest Rate
8.5%
Create a Home Valuation Report for This Property
The Home Valuation Report is an in-depth analysis detailing your home's value as well as a comparison with similar homes in the area
Home Values in the Area
Average Home Value in this Area
Purchase History
| Date | Buyer | Sale Price | Title Company |
|---|---|---|---|
| Medcalf Rochelle | $115,000 | Attorneys Title Guaranty Fun | |
| Rayburn Joann Cory | $135,000 | -- | |
| Pallone Elizabeth | -- | -- |
Source: Public Records
Mortgage History
| Date | Status | Borrower | Loan Amount |
|---|---|---|---|
| Open | Medcalf Rochelle | $109,200 | |
| Previous Owner | Rayburn Joann Cory | $131,150 | |
| Previous Owner | Pallone Elizabeth | $96,900 |
Source: Public Records
Tax History Compared to Growth
Tax History
| Year | Tax Paid | Tax Assessment Tax Assessment Total Assessment is a certain percentage of the fair market value that is determined by local assessors to be the total taxable value of land and additions on the property. | Land | Improvement |
|---|---|---|---|---|
| 2024 | $141 | $324 | $71 | $253 |
| 2023 | $136 | $324 | $71 | $253 |
| 2022 | $136 | $241 | $80 | $161 |
| 2021 | $135 | $240 | $80 | $160 |
| 2020 | $124 | $240 | $80 | $160 |
| 2019 | $133 | $253 | $75 | $178 |
| 2018 | $132 | $253 | $75 | $178 |
| 2017 | $127 | $253 | $75 | $178 |
| 2016 | $120 | $239 | $70 | $169 |
| 2015 | $120 | $239 | $70 | $169 |
| 2014 | $117 | $239 | $70 | $169 |
| 2013 | $135 | $302 | $70 | $232 |
Source: Public Records
Map
Nearby Homes
- 3106 Hermes Dr
- 2904 Athena Ct
- 2908 Athena Ct
- 1833 Pheasant Ct
- 20015 Delphi Dr
- 3324 Oregon Trail
- 3224 Cumberland Trail
- 3415 Vollmer Rd Unit 308
- 3427 Vollmer Rd Unit 209
- 3521 Park Place
- 3420 203rd St
- 2937 Kathleen Ln
- 2747 Perry Rd
- 3013 Mac Heath Crescent
- 3506 Ithaca Rd
- 1450 Tanglewood St Unit 1B
- 1433 Woodhollow Dr
- 20415 Doria Ln
- 20436 Arcadian Dr
- 3045 Scott Crescent
- 201 Lake Dr Unit 201G1
- 201 Lake Dr Unit 201G2
- 201 Lake Dr Unit 201G3
- 201 Lake Dr Unit 201A1
- 201 Lake Dr Unit 201B2
- 201 Lake Dr Unit 201B1
- 201 Lake Dr Unit 201A2
- 201 Lake Dr Unit 1A
- 201 Lake Dr Unit 2B
- 201 Lake Dr Unit 2A
- 192 Lake Dr Unit 192
- 20008 Eros Dr
- 198 Lake Dr Unit 198
- 20004 Eros Dr
- 200 Lake Dr Unit 200B1
- 200 Lake Dr Unit 200G3
- 200 Lake Dr Unit 200G1
- 200 Lake Dr Unit 200A2
- 200 Lake Dr Unit 200G4
- 200 Lake Dr Unit 200B2