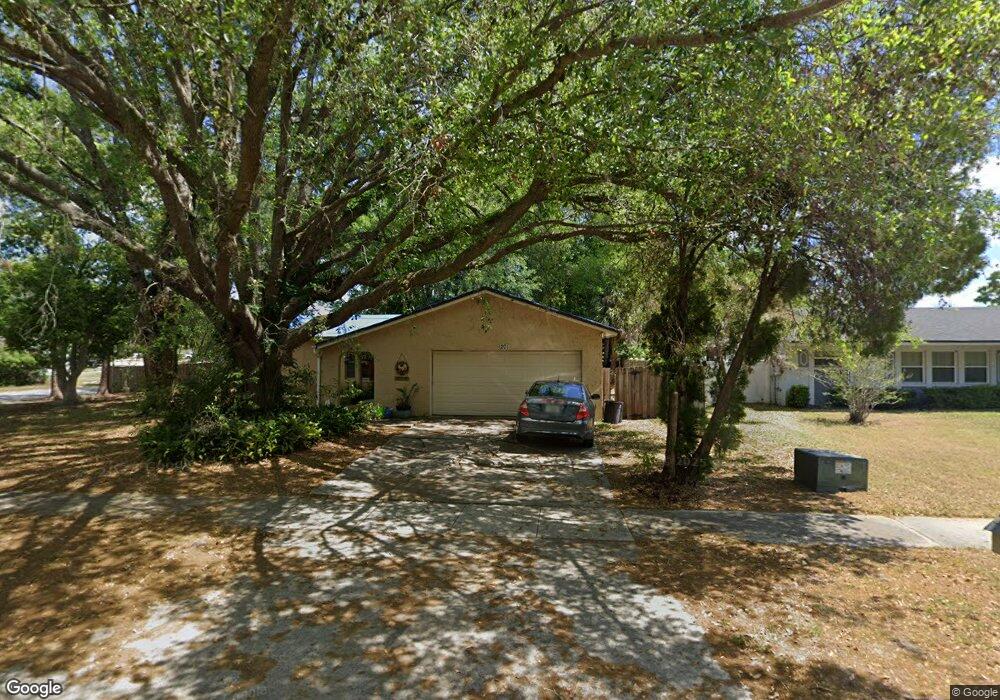
201 Lilac Ln Altamonte Springs, FL 32701
Estimated Value: $378,535 - $450,000
3
Beds
3
Baths
2,033
Sq Ft
$204/Sq Ft
Est. Value
About This Home
This home is located at 201 Lilac Ln, Altamonte Springs, FL 32701 and is currently estimated at $414,884, approximately $204 per square foot. 201 Lilac Ln is a home located in Seminole County with nearby schools including Lake Orienta Elementary School, Lyman High School, and Milwee Middle School.
Ownership History
Date
Name
Owned For
Owner Type
Purchase Details
Closed on
Nov 7, 2011
Sold by
Abra Properties Llc
Bought by
Maxan Sonia M
Current Estimated Value
Home Financials for this Owner
Home Financials are based on the most recent Mortgage that was taken out on this home.
Original Mortgage
$131,479
Interest Rate
4.25%
Mortgage Type
FHA
Purchase Details
Closed on
Mar 8, 2011
Sold by
Travis Rhonda S
Bought by
Abra Properties Llc
Purchase Details
Closed on
Oct 28, 1997
Sold by
Federal National Mortgage Assn
Bought by
Travis Rhonda S
Purchase Details
Closed on
Sep 1, 1997
Bought by
Maxan Sonia M
Purchase Details
Closed on
Aug 30, 1993
Sold by
Cristina Mary R
Bought by
Dahn Christopher W
Purchase Details
Closed on
Jul 1, 1989
Bought by
Maxan Sonia M
Purchase Details
Closed on
Jan 1, 1977
Bought by
Maxan Sonia M
Create a Home Valuation Report for This Property
The Home Valuation Report is an in-depth analysis detailing your home's value as well as a comparison with similar homes in the area
Home Values in the Area
Average Home Value in this Area
Purchase History
| Date | Buyer | Sale Price | Title Company |
|---|---|---|---|
| Maxan Sonia M | $134,900 | First Signature Title Inc | |
| Abra Properties Llc | $59,200 | None Available | |
| Travis Rhonda S | $78,900 | -- | |
| Maxan Sonia M | $100 | -- | |
| Dahn Christopher W | $82,000 | -- | |
| Maxan Sonia M | $100 | -- | |
| Maxan Sonia M | $42,500 | -- |
Source: Public Records
Mortgage History
| Date | Status | Borrower | Loan Amount |
|---|---|---|---|
| Open | Travis Rhonda S | $131,479 | |
| Closed | Maxan Sonia M | $131,479 | |
| Previous Owner | Travis Rhonda S | $117,900 | |
| Previous Owner | Travis Rhonda S | $7,555 |
Source: Public Records
Tax History Compared to Growth
Tax History
| Year | Tax Paid | Tax Assessment Tax Assessment Total Assessment is a certain percentage of the fair market value that is determined by local assessors to be the total taxable value of land and additions on the property. | Land | Improvement |
|---|---|---|---|---|
| 2024 | $1,529 | $132,657 | -- | -- |
| 2023 | $1,488 | $128,793 | $0 | $0 |
| 2021 | $1,371 | $121,400 | $0 | $0 |
| 2020 | $1,353 | $119,724 | $0 | $0 |
| 2019 | $1,335 | $117,032 | $0 | $0 |
| 2018 | $1,311 | $114,850 | $0 | $0 |
| 2017 | $1,296 | $112,488 | $0 | $0 |
| 2016 | $1,321 | $110,945 | $0 | $0 |
| 2015 | $1,335 | $109,408 | $0 | $0 |
| 2014 | $1,657 | $106,691 | $0 | $0 |
Source: Public Records
Map
Nearby Homes
- 360 Lake Ontario Ct Unit 202
- 360 Lakepointe Dr Unit 304
- 325 Lakepointe Dr Unit 304
- 345 Lakepointe Dr Unit 204
- 420 Forestway Cir Unit 206
- 320 Black Oak Ct Unit 107
- 315 Lakepointe Dr Unit 204
- 320 Forestway Cir Unit 107
- 320 Forestway Cir Unit 203
- 320 Forestway Cir Unit 102
- 351 Lone Hill Dr Unit 206
- 364 Northpointe Ct Unit 208
- 400 Lake Placid Ct Unit 204
- 345 Forestway Cir Unit 106
- 631 Northlake Blvd
- 310 Cherokee Ct Unit D
- 390 Woodside Dr Unit 302
- 220 Cherokee Ct Unit 116
- 725 Northlake Blvd Unit 66
- 725 Northlake Blvd Unit 78
- 203 Lilac Ln
- 125 Larkspur Dr
- 107 Lilac Ln
- 114 Larkspur Dr
- 103 Orienta Dr
- 124 Hollyhock Dr
- 123 Larkspur Dr
- 101 Orienta Dr
- 143 Hattaway Dr
- 105 Lilac Ln
- 141 Hattaway Dr
- 112 Larkspur Dr
- 102 Orienta Dr
- 121 Larkspur Dr
- 105 Orienta Dr
- 139 Hattaway Dr
- 122 Hollyhock Dr
- 100 Orienta Dr
- 115 Hollyhock Dr
- 103 Lilac Ln