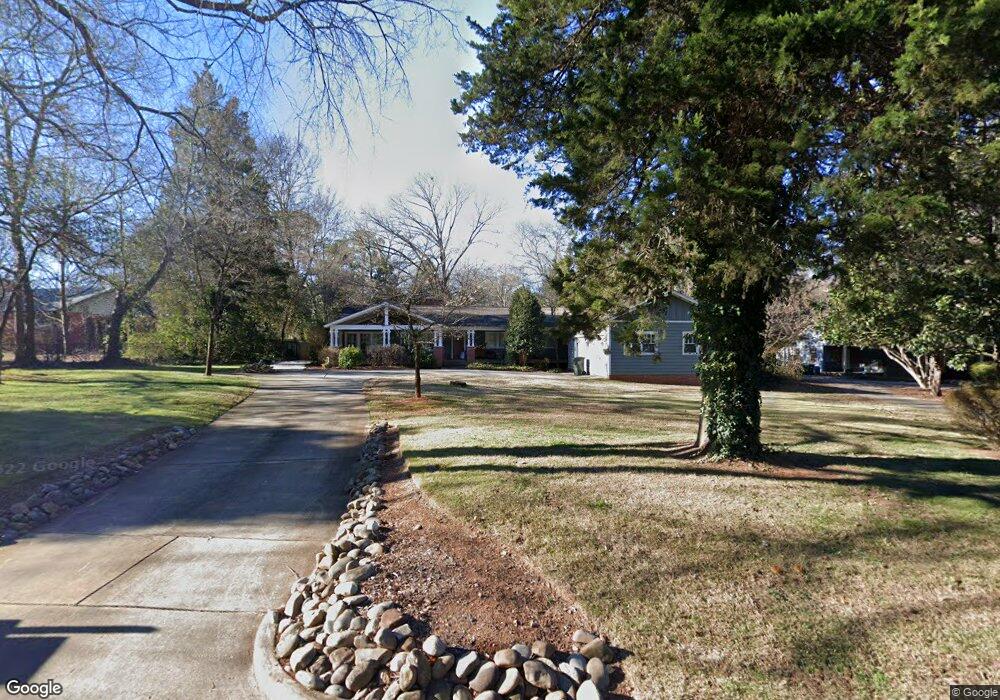
201 Lord Berkley Rd Raleigh, NC 27610
King Charles NeighborhoodEstimated Value: $741,000 - $794,000
3
Beds
3
Baths
2,318
Sq Ft
$327/Sq Ft
Est. Value
About This Home
This home is located at 201 Lord Berkley Rd, Raleigh, NC 27610 and is currently estimated at $757,037, approximately $326 per square foot. 201 Lord Berkley Rd is a home located in Wake County with nearby schools including Hunter Elementary School, Ligon Magnet Middle School, and Enloe High.
Ownership History
Date
Name
Owned For
Owner Type
Purchase Details
Closed on
Jul 11, 2025
Sold by
Fearn Milton Lewis and Rhone Tanya
Bought by
Fearn Milton Lewis
Current Estimated Value
Home Financials for this Owner
Home Financials are based on the most recent Mortgage that was taken out on this home.
Original Mortgage
$309,000
Outstanding Balance
$308,477
Interest Rate
6.85%
Mortgage Type
New Conventional
Estimated Equity
$448,560
Purchase Details
Closed on
May 13, 2016
Sold by
Sutton Charles Douglas
Bought by
Fearn Milton Lewis and Rhone Tanya
Home Financials for this Owner
Home Financials are based on the most recent Mortgage that was taken out on this home.
Original Mortgage
$399,000
Interest Rate
3.59%
Mortgage Type
New Conventional
Purchase Details
Closed on
Jan 2, 2008
Sold by
Rabbani Cheryl A Spencer and Rabbani Isaac
Bought by
Sutton Charles Douglas
Home Financials for this Owner
Home Financials are based on the most recent Mortgage that was taken out on this home.
Original Mortgage
$16,345
Interest Rate
6.15%
Mortgage Type
Unknown
Create a Home Valuation Report for This Property
The Home Valuation Report is an in-depth analysis detailing your home's value as well as a comparison with similar homes in the area
Home Values in the Area
Average Home Value in this Area
Purchase History
| Date | Buyer | Sale Price | Title Company |
|---|---|---|---|
| Fearn Milton Lewis | -- | None Listed On Document | |
| Fearn Milton Lewis | $420,000 | None Available | |
| Sutton Charles Douglas | $160,000 | None Available |
Source: Public Records
Mortgage History
| Date | Status | Borrower | Loan Amount |
|---|---|---|---|
| Open | Fearn Milton Lewis | $309,000 | |
| Previous Owner | Fearn Milton Lewis | $399,000 | |
| Previous Owner | Sutton Charles Douglas | $16,345 | |
| Previous Owner | Sutton Charles Douglas | $129,354 |
Source: Public Records
Tax History Compared to Growth
Tax History
| Year | Tax Paid | Tax Assessment Tax Assessment Total Assessment is a certain percentage of the fair market value that is determined by local assessors to be the total taxable value of land and additions on the property. | Land | Improvement |
|---|---|---|---|---|
| 2025 | $5,651 | $645,650 | $299,250 | $346,400 |
| 2024 | $5,627 | $645,650 | $299,250 | $346,400 |
| 2023 | $5,665 | $517,901 | $189,000 | $328,901 |
| 2022 | $5,264 | $517,901 | $189,000 | $328,901 |
| 2021 | $5,059 | $517,901 | $189,000 | $328,901 |
| 2020 | $4,967 | $517,901 | $189,000 | $328,901 |
| 2019 | $3,746 | $321,514 | $56,000 | $265,514 |
| 2018 | $3,533 | $321,514 | $56,000 | $265,514 |
| 2017 | $3,365 | $321,514 | $56,000 | $265,514 |
| 2016 | $3,296 | $321,514 | $56,000 | $265,514 |
| 2015 | $2,768 | $265,383 | $46,000 | $219,383 |
| 2014 | $2,626 | $265,383 | $46,000 | $219,383 |
Source: Public Records
Map
Nearby Homes
- 125 Lord Ashley Rd
- 114 Clarendon Crescent
- 100 Farris Ct
- 460 Dickens Dr
- 304 N King Charles Rd Unit 102
- 304 N King Charles Rd Unit 101
- 2309 Bertie Dr
- 301 N King Charles Rd
- 408 Locke Ln
- 2302 Derby Dr
- 105 Stonelake Ct
- 2341 New Bern Ave
- 113 Tall Rock Ct
- 2405 Derby Dr
- 105 Tall Rock Ct
- 2331 Stevens Rd
- 2406 Stevens Rd
- 2304 Nelson St
- 2458 Stevens Rd
- 1611 Poole Rd
- 205 Lord Berkley Rd
- 113 Lord Berkley Rd
- 209 Lord Berkley Rd
- 109 Lord Berkley Rd
- 112 Lord Ashley Rd
- 108 Lord Ashley Rd
- 116 Lord Ashley Rd
- 200 Lord Berkley Rd
- 106 Lord Berkley Rd
- 204 Lord Berkley Rd
- 215 Lord Berkley Rd
- 2105 New Bern Ave
- 112 Lord Berkley Rd
- 2111 New Bern Ave
- 208 Lord Berkley Rd
- 120 Lord Ashley Rd
- 2115 New Bern Ave
- 104 Lord Ashley Rd
- 108 Lord Berkley Rd
- 212 Lord Berkley Rd