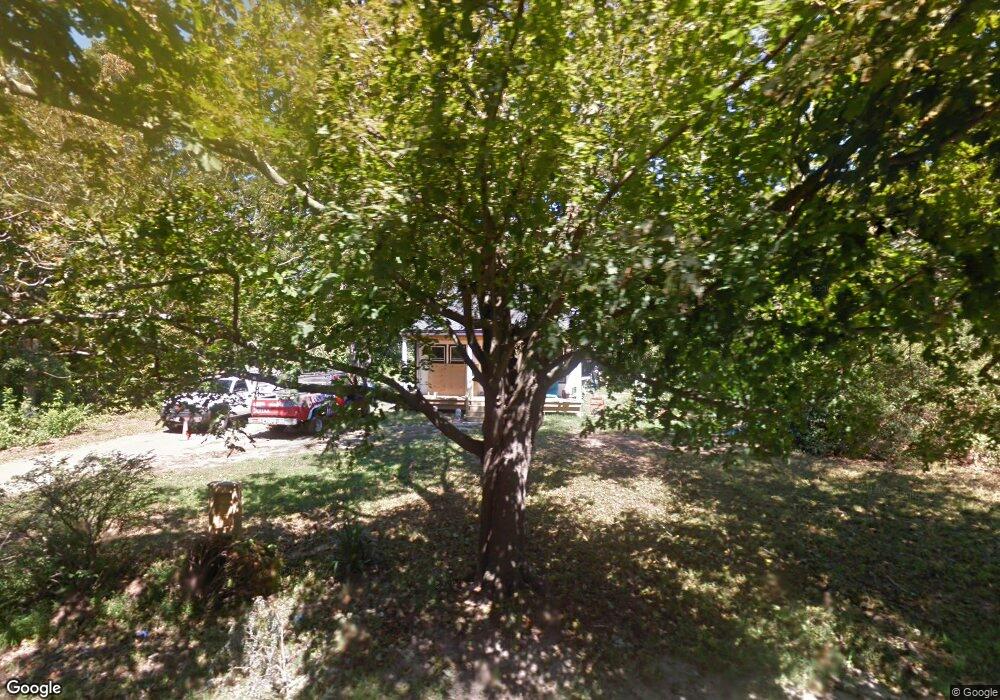
201 Main St Mashpee, MA 02649
Estimated Value: $565,000 - $728,000
2
Beds
1
Bath
650
Sq Ft
$1,000/Sq Ft
Est. Value
About This Home
This home is located at 201 Main St, Mashpee, MA 02649 and is currently estimated at $649,765, approximately $999 per square foot. 201 Main St is a home located in Barnstable County with nearby schools including Kenneth C. Coombs School, Quashnet School, and Mashpee Middle School.
Ownership History
Date
Name
Owned For
Owner Type
Purchase Details
Closed on
Jul 20, 2023
Sold by
Peters Morgan J
Bought by
Nsase Ret and Peters
Current Estimated Value
Purchase Details
Closed on
Apr 19, 1996
Sold by
Landers Mary G and Landers Harry M
Bought by
Peters Morgan James
Home Financials for this Owner
Home Financials are based on the most recent Mortgage that was taken out on this home.
Original Mortgage
$62,900
Interest Rate
7.34%
Mortgage Type
Purchase Money Mortgage
Create a Home Valuation Report for This Property
The Home Valuation Report is an in-depth analysis detailing your home's value as well as a comparison with similar homes in the area
Purchase History
| Date | Buyer | Sale Price | Title Company |
|---|---|---|---|
| Nsase Ret | -- | None Available | |
| Peters Morgan James | $70,000 | -- |
Source: Public Records
Mortgage History
| Date | Status | Borrower | Loan Amount |
|---|---|---|---|
| Previous Owner | Peters Morgan James | $62,900 |
Source: Public Records
Tax History
| Year | Tax Paid | Tax Assessment Tax Assessment Total Assessment is a certain percentage of the fair market value that is determined by local assessors to be the total taxable value of land and additions on the property. | Land | Improvement |
|---|---|---|---|---|
| 2025 | $3,900 | $589,100 | $223,600 | $365,500 |
| 2024 | $3,573 | $555,700 | $203,300 | $352,400 |
| 2023 | $3,381 | $482,300 | $193,600 | $288,700 |
| 2022 | $3,309 | $405,000 | $166,100 | $238,900 |
| 2021 | $2,560 | $358,400 | $149,700 | $208,700 |
| 2020 | $2,549 | $346,900 | $143,900 | $203,000 |
| 2019 | $3,025 | $334,300 | $143,900 | $190,400 |
| 2018 | $2,259 | $322,600 | $143,900 | $178,700 |
| 2017 | $2,865 | $311,800 | $150,000 | $161,800 |
| 2016 | $2,790 | $302,000 | $150,000 | $152,000 |
| 2015 | $2,690 | $295,300 | $150,000 | $145,300 |
| 2014 | $2,376 | $253,000 | $121,400 | $131,600 |
Source: Public Records
Map
Nearby Homes
- 173 Main St
- 235 Main St
- 45 Pequot Rd
- 22 Stratford Ridge Unit 22
- 4 Bishops Park
- 35 Claulise Ln
- 16 Spring Brook Ln
- 63 Deer Ridge Rd
- 20 Lakewood Dr
- 75 Bob White Run
- 170 Forest Hills Rd
- 45 Fox Hill Rd
- 226 Dunrobin Rd
- 16 Balfour Ln
- 1456 Santuit-Newtown Rd
- 22 Candlewood Ln
- 68 Fox Hill Rd
- 70 Cape Dr Unit 14D
- 70 Cape Dr Unit 15D
- 70 Cape Dr Unit 11D
Your Personal Tour Guide
Ask me questions while you tour the home.