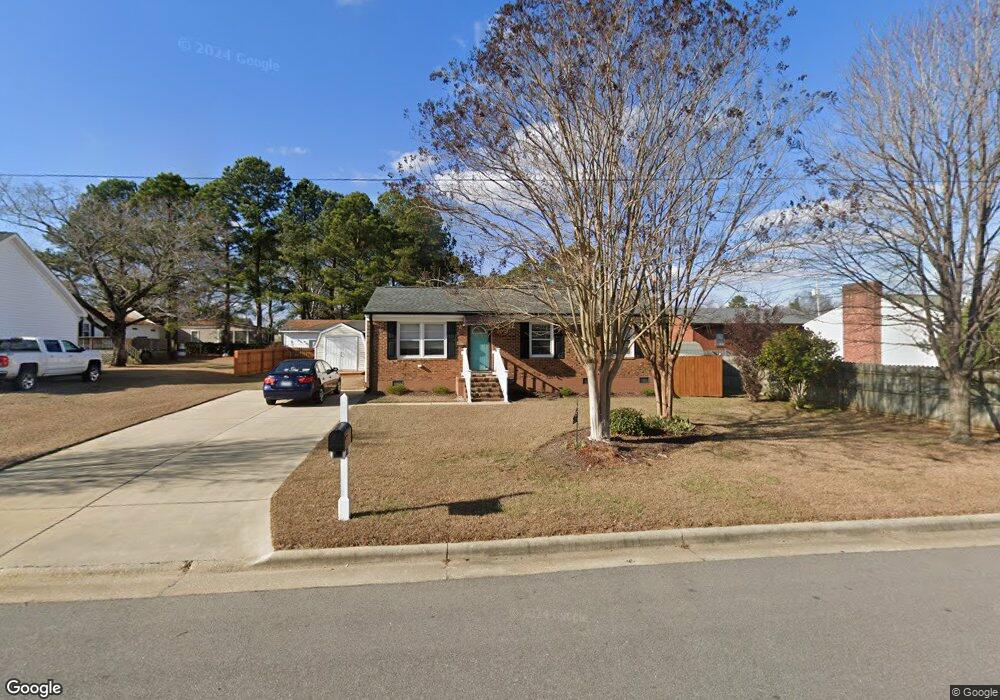
201 N Mckinley St Benson, NC 27504
Estimated Value: $200,000 - $222,000
3
Beds
2
Baths
1,130
Sq Ft
$187/Sq Ft
Est. Value
About This Home
This home is located at 201 N Mckinley St, Benson, NC 27504 and is currently estimated at $211,753, approximately $187 per square foot. 201 N Mckinley St is a home located in Johnston County with nearby schools including Benson Elementary School, Benson Middle School, and South Johnston High School.
Ownership History
Date
Name
Owned For
Owner Type
Purchase Details
Closed on
Jul 21, 2017
Sold by
Roach Whitney Michelle
Bought by
Lee James Sherrill and Lee Annie Lou
Current Estimated Value
Purchase Details
Closed on
May 25, 2016
Sold by
Lard Garrison Ruth Tart and Lard Garrison Jr Marshall
Bought by
Roach Whitney Michelle
Home Financials for this Owner
Home Financials are based on the most recent Mortgage that was taken out on this home.
Original Mortgage
$97,686
Interest Rate
3.58%
Mortgage Type
New Conventional
Purchase Details
Closed on
Oct 14, 2005
Sold by
Buildingwell Llc
Bought by
Jernigan Ruth Tart
Home Financials for this Owner
Home Financials are based on the most recent Mortgage that was taken out on this home.
Original Mortgage
$94,000
Interest Rate
5.25%
Mortgage Type
Adjustable Rate Mortgage/ARM
Purchase Details
Closed on
Apr 1, 2004
Sold by
Buildingwell Llc
Bought by
Stanley Norman K
Create a Home Valuation Report for This Property
The Home Valuation Report is an in-depth analysis detailing your home's value as well as a comparison with similar homes in the area
Home Values in the Area
Average Home Value in this Area
Purchase History
| Date | Buyer | Sale Price | Title Company |
|---|---|---|---|
| Lee James Sherrill | $106,000 | None Available | |
| Roach Whitney Michelle | $95,000 | None Available | |
| Jernigan Ruth Tart | $94,000 | None Available | |
| Stanley Norman K | $53,000 | -- |
Source: Public Records
Mortgage History
| Date | Status | Borrower | Loan Amount |
|---|---|---|---|
| Previous Owner | Roach Whitney Michelle | $97,686 | |
| Previous Owner | Jernigan Ruth Tart | $94,000 |
Source: Public Records
Tax History Compared to Growth
Tax History
| Year | Tax Paid | Tax Assessment Tax Assessment Total Assessment is a certain percentage of the fair market value that is determined by local assessors to be the total taxable value of land and additions on the property. | Land | Improvement |
|---|---|---|---|---|
| 2025 | $1,154 | $204,230 | $31,910 | $172,320 |
| 2024 | $672 | $105,060 | $23,860 | $81,200 |
| 2023 | $672 | $105,060 | $23,860 | $81,200 |
| 2022 | $672 | $0 | $0 | $0 |
| 2021 | $672 | $105,060 | $23,860 | $81,200 |
| 2020 | $678 | $105,060 | $23,860 | $81,200 |
| 2019 | $1,355 | $105,060 | $23,860 | $81,200 |
| 2018 | $534 | $80,900 | $20,570 | $60,330 |
| 2017 | $1,068 | $80,900 | $20,570 | $60,330 |
| 2016 | $1,060 | $80,900 | $20,570 | $60,330 |
| 2015 | $1,060 | $80,900 | $20,570 | $60,330 |
| 2014 | $1,060 | $80,900 | $20,570 | $60,330 |
Source: Public Records
Map
Nearby Homes
- 205 N Augusta Ave
- 702 W Main St
- 416 W Martin St
- 0 W Church St
- 116 Colonade Ct
- 301 W Hill St
- 300 S Pine St
- 302 S Pine St
- 324 W Harnett St
- 316 W Parrish Dr
- 318 W Harnett St
- 107 S Mule Way Unit 90
- 107 S Mule Way
- 1372 N Carolina 50
- 303 W Parrish Dr
- 137 Benson Village Dr Unit 74
- 137 Benson Village Dr
- 517 W Brocklyn St Unit 63p
- 704 N Lincoln St
- Shepherd Plan at Benson Village
- 601 W Hill St
- 600 W Church St
- 602 W Church St
- 603 W Hill St
- 204 Royster St
- 204 N Royster St
- 204 N Mckinley St
- 506 W Church St
- 512 W Church St
- 604 W Church St
- 512 W Church St
- 507 W Hill St
- 204 N Augusta Ave
- 202 N Mckinley St
- 202 N Royster St
- 202 N Royster St
- 510 W Church St
- 510 W Church St
- 206 N Augusta Ave Unit N
- 508 W Church St