
Seller's Agent in 2024
Michael Proffitt
Great Places Realty
(402) 750-2438
105 Total Sales


Estimated Value: $94,000 - $177,000
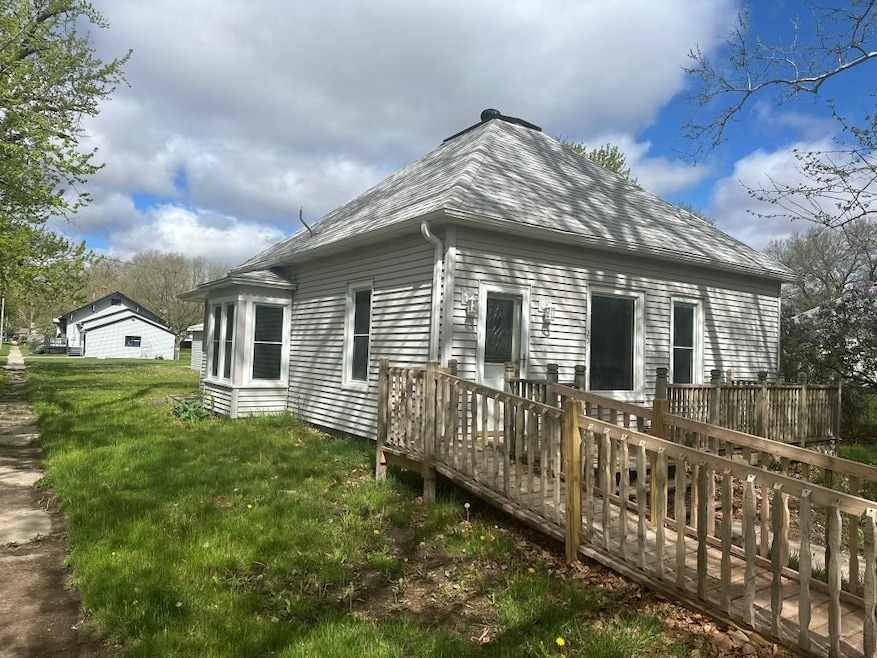
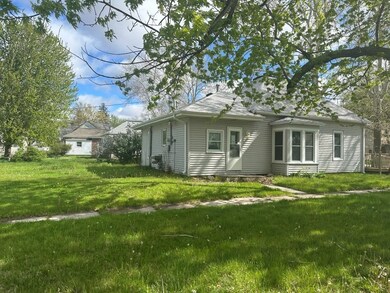
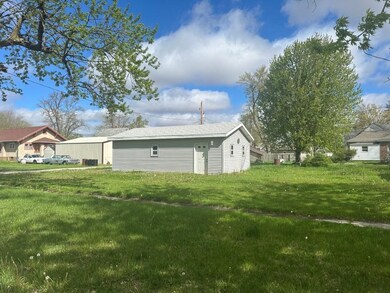
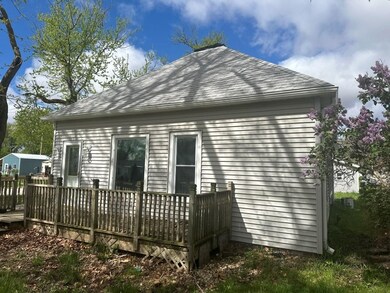
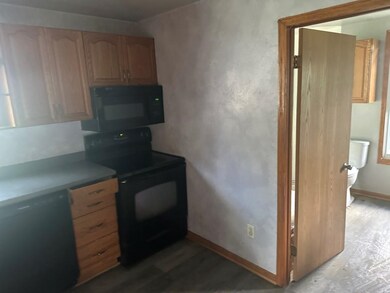
Great starter home or investment property on a corner lot in Hooper. The home features a number of more recent upgrades including, roof, HVAC, windows and siding. The home is being sold as-is and seller will not make repairs. Buyers must be pre approved for financing or be able to prove they have the funds to purchase prior to offering. Loans based upon condition may not work because the property is being sold as-is. Agent read agent only comments for instructions. This property is subject to the Freddie Mac First Look Initiative. The Freddie Mac First Look Initiative limits offers from being entertained during the first 20 days of listing to owner occupant and non-profit buyers. Investor offers will be responded to after the first look period ends on 06/05/2024
Last Agent to Sell the Property
Great Places Realty License #20090017 Listed on: 05/16/2024
Last Buyer's Agent
Non Member
NORFOLK BOARD OF REALTORS
| Date | Buyer | Sale Price | Title Company |
|---|---|---|---|
| Colhouer Cory J | $75,000 | -- | |
| -- | $20,000 | -- |
| Date | Event | Price | List to Sale | Price per Sq Ft |
|---|---|---|---|---|
| 09/12/2024 09/12/24 | Sold | $75,000 | -6.1% | $73 / Sq Ft |
| 08/14/2024 08/14/24 | Pending | -- | -- | -- |
| 07/31/2024 07/31/24 | Price Changed | $79,900 | -11.1% | $78 / Sq Ft |
| 07/01/2024 07/01/24 | Price Changed | $89,900 | -10.0% | $88 / Sq Ft |
| 05/16/2024 05/16/24 | For Sale | $99,900 | -- | $97 / Sq Ft |
| Year | Tax Paid | Tax Assessment Tax Assessment Total Assessment is a certain percentage of the fair market value that is determined by local assessors to be the total taxable value of land and additions on the property. | Land | Improvement |
|---|---|---|---|---|
| 2024 | $1,620 | $97,318 | $19,500 | $77,818 |
| 2023 | $1,769 | $83,684 | $12,350 | $71,334 |
| 2022 | $1,544 | $76,493 | $12,350 | $64,143 |
| 2021 | $1,396 | $73,241 | $11,724 | $61,517 |
| 2020 | $1,192 | $57,591 | $9,401 | $48,190 |
| 2019 | $987 | $47,133 | $12,428 | $34,705 |
| 2018 | $938 | $44,050 | $11,615 | $32,435 |
| 2017 | $930 | $43,055 | $12,165 | $30,890 |
| 2016 | $9 | $43,055 | $12,165 | $30,890 |
| 2015 | $988 | $43,055 | $12,165 | $30,890 |
| 2012 | -- | $42,200 | $11,310 | $30,890 |
Seller's Agent in 2024
Michael Proffitt
Great Places Realty
(402) 750-2438
105 Total Sales
N
Buyer's Agent in 2024
Non Member
NORFOLK BOARD OF REALTORS
Source: Norfolk Board of REALTORS®
MLS Number: 240337
APN: 270073577
Disclaimer: Certain information contained herein is derived from information provided by parties other than Homes.com. All information provided is deemed reliable, but is not guaranteed to be accurate and should be independently verified.
![]() IDX information is provided exclusively for personal, non-commercial use, and may not be used for any purpose other than to identify prospective properties consumers may be interested in purchasing. Information is deemed reliable but not guaranteed.
IDX information is provided exclusively for personal, non-commercial use, and may not be used for any purpose other than to identify prospective properties consumers may be interested in purchasing. Information is deemed reliable but not guaranteed.
Ask me questions while you tour the home.