Estimated Value: $453,000 - $508,000
4
Beds
3
Baths
1,775
Sq Ft
$272/Sq Ft
Est. Value
About This Home
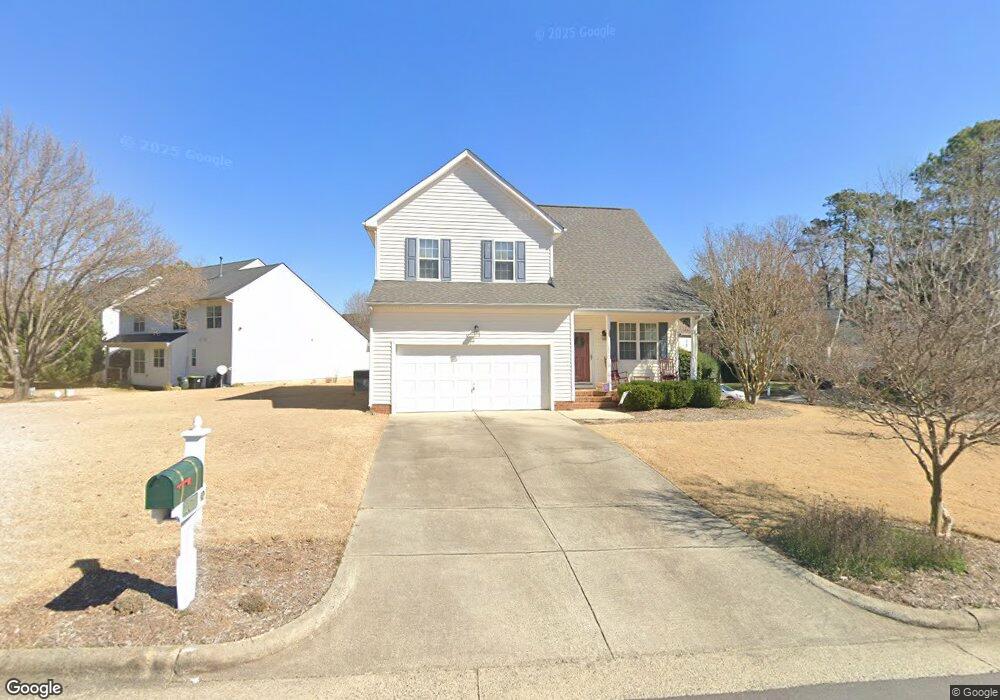
This home is located at 201 Pikeview Ln, Apex, NC 27502 and is currently estimated at $481,923, approximately $271 per square foot. 201 Pikeview Ln is a home located in Wake County with nearby schools including Baucom Elementary School, Apex Middle, and Apex High School.
Ownership History
Date
Name
Owned For
Owner Type
Purchase Details
Closed on
Feb 23, 2007
Sold by
Taylor Ritchie W and Taylor Elizabeth Irene
Bought by
Wical John and Wical Lora
Current Estimated Value
Home Financials for this Owner
Home Financials are based on the most recent Mortgage that was taken out on this home.
Original Mortgage
$49,500
Outstanding Balance
$6,161
Interest Rate
6.16%
Mortgage Type
Credit Line Revolving
Estimated Equity
$475,762
Purchase Details
Closed on
Jun 11, 1999
Sold by
Engle Homes/North Carolina Inc
Bought by
Taylor Ritchie Walter and Taylor Elizabeth Irene Crane
Create a Home Valuation Report for This Property
The Home Valuation Report is an in-depth analysis detailing your home's value as well as a comparison with similar homes in the area
Purchase History
| Date | Buyer | Sale Price | Title Company |
|---|---|---|---|
| Wical John | $198,000 | None Available | |
| Taylor Ritchie Walter | $166,500 | -- |
Source: Public Records
Mortgage History
| Date | Status | Borrower | Loan Amount |
|---|---|---|---|
| Open | Wical John | $49,500 | |
| Open | Wical John | $148,500 |
Source: Public Records
Tax History
| Year | Tax Paid | Tax Assessment Tax Assessment Total Assessment is a certain percentage of the fair market value that is determined by local assessors to be the total taxable value of land and additions on the property. | Land | Improvement |
|---|---|---|---|---|
| 2025 | $4,016 | $457,646 | $200,000 | $257,646 |
| 2024 | $3,926 | $457,646 | $200,000 | $257,646 |
Source: Public Records
Map
Nearby Homes
- 101 Rocklyn Ln
- 0 Jb Morgan Rd Unit 10051948
- 1006 Cherokee Sunset Rd
- 1105 Capitata Crossing
- 111 Lemon Drop Cir
- 1224 Tartarian Trail
- 104 Fair Spring Ct
- 1008 Daresbury Dr
- 415 Fairview Rd
- 402 Village Loop Dr
- 400 Village Loop Dr
- 203 Milky Way Dr
- 506 W Chatham St
- 1209 Haywards Heath Ln
- 440 Oak Pine Dr
- 102 Licorice Dr
- 3021 White Cloud Cir
- 120 Licorice Dr
- 1303 Goldspot Ct
- 1614 Brussels Dr
- 915 Bryan Dr
- 205 Pikeview Ln
- 202 Pikeview Ln
- 909 Bryan Dr
- 200 Pikeview Ln
- 920 Bryan Dr
- 204 Pikeview Ln
- 906 Bristol Blue St
- 207 Pikeview Ln
- 206 Pikeview Ln
- 924 Bryan Dr
- 100 Rocklyn Ln
- 208 Pikeview Ln
- 904 Bristol Blue St
- 105 Rocklyn Ln
- 209 Pikeview Ln
- 104 Rocklyn Ln
- 905 Bristol Blue St
- 210 Pikeview Ln
- 210 Pike View Ln
Your Personal Tour Guide
Ask me questions while you tour the home.