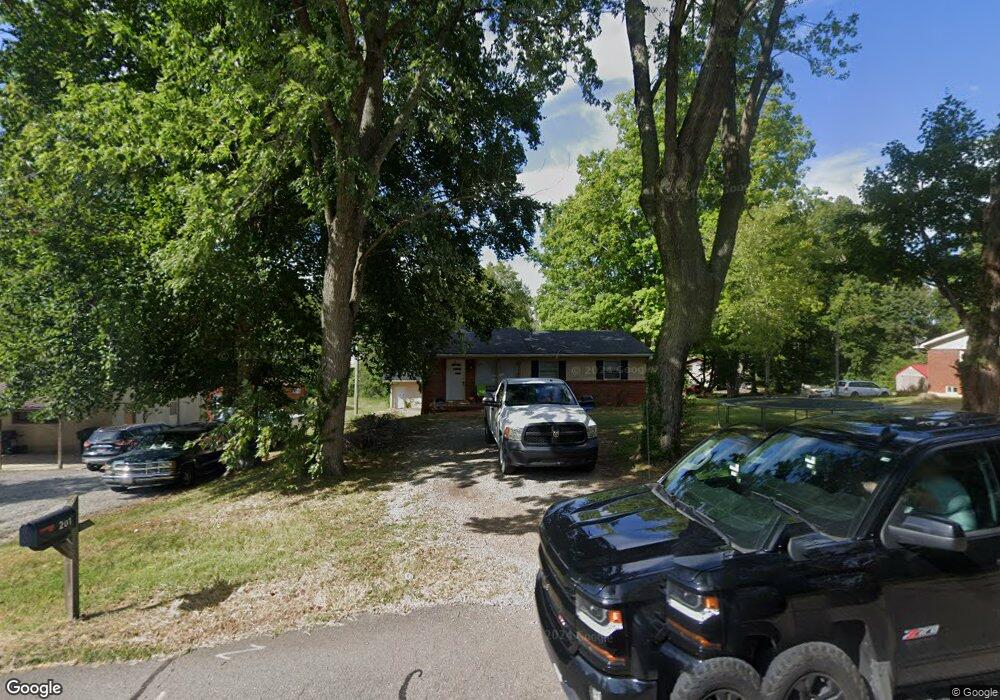
201 Pitt Ln Springfield, TN 37172
Estimated Value: $223,000 - $261,000
Studio
2
Baths
1,088
Sq Ft
$223/Sq Ft
Est. Value
About This Home
This home is located at 201 Pitt Ln, Springfield, TN 37172 and is currently estimated at $242,479, approximately $222 per square foot. 201 Pitt Ln is a home located in Robertson County with nearby schools including Westside Elementary School, Cheatham Park Elementary School, and Jo Byrns High School.
Ownership History
Date
Name
Owned For
Owner Type
Purchase Details
Closed on
Aug 5, 2005
Sold by
Smith Richard E
Bought by
Stevens Wayne Tr
Current Estimated Value
Purchase Details
Closed on
Oct 9, 2003
Sold by
Craft Wayne
Bought by
Smtih Mary C and Smtih Richard E
Home Financials for this Owner
Home Financials are based on the most recent Mortgage that was taken out on this home.
Original Mortgage
$77,080
Interest Rate
6.45%
Purchase Details
Closed on
Oct 3, 2003
Bought by
Smith Richard E and Smith Mary C
Home Financials for this Owner
Home Financials are based on the most recent Mortgage that was taken out on this home.
Original Mortgage
$77,080
Interest Rate
6.45%
Purchase Details
Closed on
May 2, 2003
Sold by
Apple Buford T and Apple Lucinda
Bought by
Carft Wayne
Purchase Details
Closed on
Aug 26, 1957
Bought by
Apple Buford T & Apple Lucinda
Create a Home Valuation Report for This Property
The Home Valuation Report is an in-depth analysis detailing your home's value as well as a comparison with similar homes in the area
Home Values in the Area
Average Home Value in this Area
Purchase History
We collect this data history from publicly available records. To have your information removed, we recommend requesting removal directly through your county’s website.
| Date | Buyer | Sale Price | Title Company |
|---|---|---|---|
| Stevens Wayne Tr | $71,555 | -- | |
| Smtih Mary C | $96,350 | -- | |
| Smith Richard E | $96,400 | -- | |
| Carft Wayne | $35,500 | -- | |
| Apple Buford T & Apple Lucinda | -- | -- |
Source: Public Records
Mortgage History
We collect this data history from publicly available records. To have your information removed, we recommend requesting removal directly through your county’s website.
| Date | Status | Borrower | Loan Amount |
|---|---|---|---|
| Previous Owner | Apple Buford T & Apple Lucinda | $77,080 | |
| Previous Owner | Apple Buford T & Apple Lucinda | $77,080 |
Source: Public Records
Tax History
| Year | Tax Paid | Tax Assessment Tax Assessment Total Assessment is a certain percentage of the fair market value that is determined by local assessors to be the total taxable value of land and additions on the property. | Land | Improvement |
|---|---|---|---|---|
| 2025 | -- | $58,900 | $22,500 | $36,400 |
| 2024 | -- | $58,900 | $22,500 | $36,400 |
| 2023 | $1,475 | $58,900 | $22,500 | $36,400 |
| 2022 | $1,001 | $27,450 | $5,500 | $21,950 |
| 2021 | $1,001 | $27,450 | $5,500 | $21,950 |
| 2020 | $1,001 | $27,450 | $5,500 | $21,950 |
| 2019 | $30,107 | $27,450 | $5,500 | $21,950 |
| 2018 | $1,001 | $27,450 | $5,500 | $21,950 |
| 2017 | $1,028 | $24,000 | $4,925 | $19,075 |
| 2016 | $1,028 | $24,000 | $4,925 | $19,075 |
| 2015 | $998 | $24,000 | $4,925 | $19,075 |
| 2014 | $998 | $24,000 | $4,925 | $19,075 |
Source: Public Records
Map
Nearby Homes
- 102 Cofer Dr
- 201 Pleasant Hill Dr
- 631 Berry Cir
- 1503 5th Ave W
- 7373 New Chapel Rd
- 745 Cedar Ln
- 212 Juanita Dr
- 1507 5th Ave W
- 5148 Highway 49 W
- 703 5th Ave W
- 610 5th Ave W
- 409 7th Ave W
- 795 19th Ave W
- 2016 Bessie St
- 2083 Bessie St
- 1421 Lawrence Ln
- 2067 Bessie St
- 698 19th Ave W
- 1001 Cheatham St
- 414 21st Ave W
Your Personal Tour Guide
Ask me questions while you tour the home.