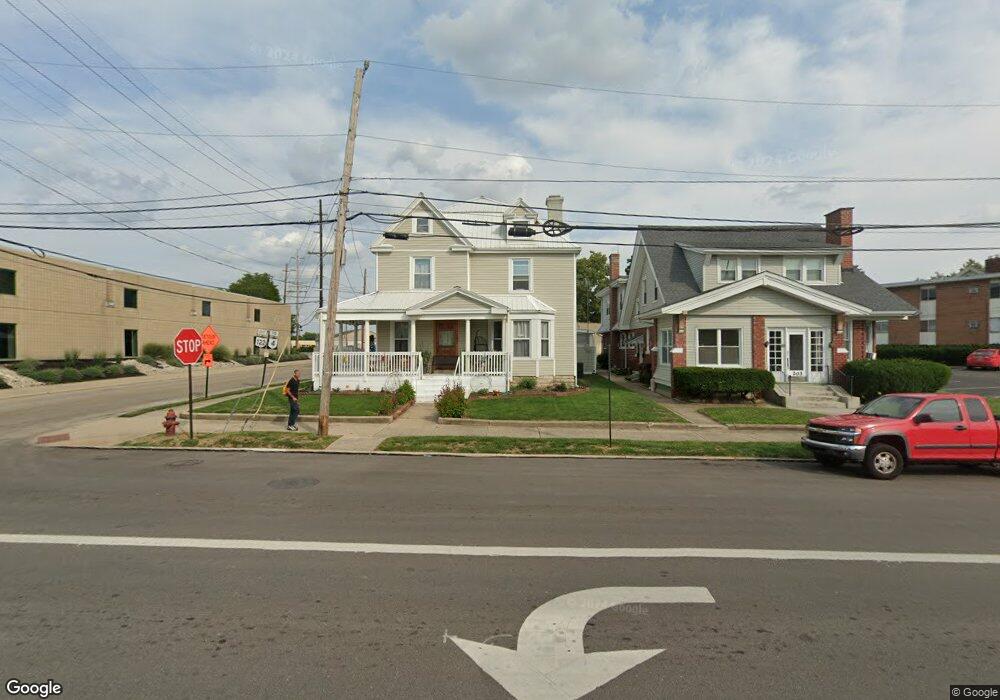
201 S Broad St Middletown, OH 45044
South Middletown NeighborhoodEstimated Value: $193,051 - $241,000
4
Beds
2
Baths
2,688
Sq Ft
$81/Sq Ft
Est. Value
About This Home
This home is located at 201 S Broad St, Middletown, OH 45044 and is currently estimated at $217,013, approximately $80 per square foot. 201 S Broad St is a home located in Butler County with nearby schools including Rosa Parks Elementary School, Highview 6th Grade Center, and Middletown Middle School.
Ownership History
Date
Name
Owned For
Owner Type
Purchase Details
Closed on
Feb 20, 2016
Sold by
Combs James Michael and Combs Nancy Summers
Bought by
Combs James M and Combs Nancy Summers
Current Estimated Value
Home Financials for this Owner
Home Financials are based on the most recent Mortgage that was taken out on this home.
Original Mortgage
$168,087
Outstanding Balance
$102,321
Interest Rate
3.92%
Mortgage Type
FHA
Estimated Equity
$114,692
Purchase Details
Closed on
Jun 24, 2011
Sold by
Combs Nancy Summers
Bought by
Combs James Michael
Purchase Details
Closed on
Mar 6, 1995
Sold by
Griffith Deborah A
Bought by
Combs James and Combs Nancy
Home Financials for this Owner
Home Financials are based on the most recent Mortgage that was taken out on this home.
Original Mortgage
$50,000
Interest Rate
9.12%
Mortgage Type
New Conventional
Purchase Details
Closed on
Feb 1, 1993
Purchase Details
Closed on
Aug 1, 1989
Create a Home Valuation Report for This Property
The Home Valuation Report is an in-depth analysis detailing your home's value as well as a comparison with similar homes in the area
Home Values in the Area
Average Home Value in this Area
Purchase History
| Date | Buyer | Sale Price | Title Company |
|---|---|---|---|
| Combs James M | -- | None Available | |
| Combs James Michael | -- | Attorney | |
| Combs James | $50,000 | -- | |
| -- | $43,900 | -- | |
| -- | $33,500 | -- |
Source: Public Records
Mortgage History
| Date | Status | Borrower | Loan Amount |
|---|---|---|---|
| Open | Combs James M | $168,087 | |
| Closed | Combs James | $50,000 |
Source: Public Records
Tax History Compared to Growth
Tax History
| Year | Tax Paid | Tax Assessment Tax Assessment Total Assessment is a certain percentage of the fair market value that is determined by local assessors to be the total taxable value of land and additions on the property. | Land | Improvement |
|---|---|---|---|---|
| 2024 | $1,786 | $51,550 | $4,970 | $46,580 |
| 2023 | $1,776 | $50,730 | $4,970 | $45,760 |
| 2022 | $1,192 | $36,810 | $4,970 | $31,840 |
| 2021 | $1,149 | $36,810 | $4,970 | $31,840 |
| 2020 | $1,194 | $36,810 | $4,970 | $31,840 |
| 2019 | $1,874 | $25,860 | $5,000 | $20,860 |
| 2018 | $595 | $25,860 | $5,000 | $20,860 |
| 2017 | $596 | $25,860 | $5,000 | $20,860 |
| 2016 | $1,584 | $22,980 | $5,000 | $17,980 |
| 2015 | $1,262 | $22,980 | $5,000 | $17,980 |
| 2014 | $2,006 | $22,980 | $5,000 | $17,980 |
| 2013 | $2,006 | $20,500 | $5,000 | $15,500 |
Source: Public Records
Map
Nearby Homes