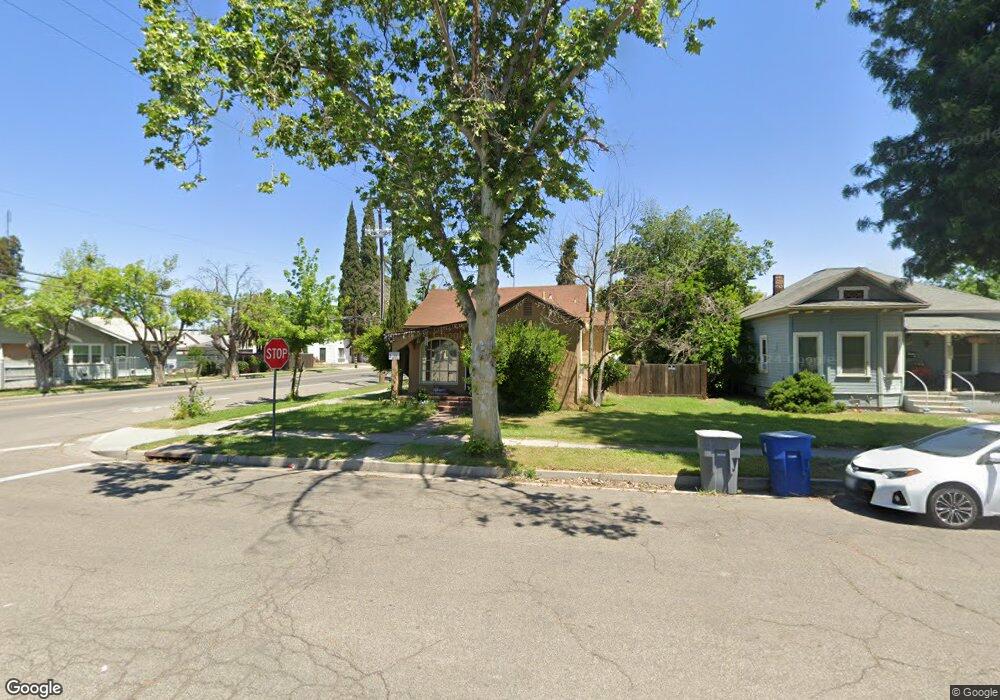
201 S J St Madera, CA 93637
Downtown Madera NeighborhoodEstimated Value: $195,000 - $331,000
2
Beds
1
Bath
968
Sq Ft
$284/Sq Ft
Est. Value
About This Home
This home is located at 201 S J St, Madera, CA 93637 and is currently estimated at $275,347, approximately $284 per square foot. 201 S J St is a home located in Madera County with nearby schools including James Madison Elementary School, Thomas Jefferson Middle School, and Madera High School.
Ownership History
Date
Name
Owned For
Owner Type
Purchase Details
Closed on
Oct 8, 2025
Sold by
Baca Juan M
Bought by
Ruiz Juan Manuel Baca and Rodriguez Angelica Maria
Current Estimated Value
Home Financials for this Owner
Home Financials are based on the most recent Mortgage that was taken out on this home.
Original Mortgage
$210,000
Outstanding Balance
$209,434
Interest Rate
6.56%
Mortgage Type
New Conventional
Estimated Equity
$65,913
Purchase Details
Closed on
Jun 19, 2002
Sold by
Gordon Frank Joseph and Gordon Betty Lou
Bought by
Baca Juan M
Home Financials for this Owner
Home Financials are based on the most recent Mortgage that was taken out on this home.
Original Mortgage
$68,000
Interest Rate
6.86%
Mortgage Type
Seller Take Back
Purchase Details
Closed on
Sep 17, 2001
Sold by
Gordon Betty Lou
Bought by
Gordon Frank Joseph and Gordon Betty Lou
Create a Home Valuation Report for This Property
The Home Valuation Report is an in-depth analysis detailing your home's value as well as a comparison with similar homes in the area
Home Values in the Area
Average Home Value in this Area
Purchase History
| Date | Buyer | Sale Price | Title Company |
|---|---|---|---|
| Ruiz Juan Manuel Baca | -- | First American Title | |
| Baca Juan M | $85,000 | Chicago Title Co | |
| Gordon Frank Joseph | $34,000 | Chicago Title Co | |
| Gordon Frank Joseph | -- | -- |
Source: Public Records
Mortgage History
| Date | Status | Borrower | Loan Amount |
|---|---|---|---|
| Open | Ruiz Juan Manuel Baca | $210,000 | |
| Previous Owner | Baca Juan M | $68,000 |
Source: Public Records
Tax History
| Year | Tax Paid | Tax Assessment Tax Assessment Total Assessment is a certain percentage of the fair market value that is determined by local assessors to be the total taxable value of land and additions on the property. | Land | Improvement |
|---|---|---|---|---|
| 2025 | $1,446 | $123,085 | $36,196 | $86,889 |
| 2023 | $1,446 | $118,308 | $34,792 | $83,516 |
| 2022 | $1,352 | $115,989 | $34,110 | $81,879 |
| 2021 | $1,327 | $113,716 | $33,442 | $80,274 |
| 2020 | $1,351 | $112,551 | $33,100 | $79,451 |
| 2019 | $1,227 | $100,741 | $27,530 | $73,211 |
| 2018 | $1,155 | $100,741 | $27,530 | $73,211 |
| 2017 | $1,110 | $95,944 | $26,219 | $69,725 |
| 2016 | $1,083 | $94,063 | $27,666 | $66,397 |
| 2015 | $1,052 | $92,650 | $27,250 | $65,400 |
| 2014 | $920 | $85,000 | $25,000 | $60,000 |
Source: Public Records
Map
Nearby Homes
Your Personal Tour Guide
Ask me questions while you tour the home.