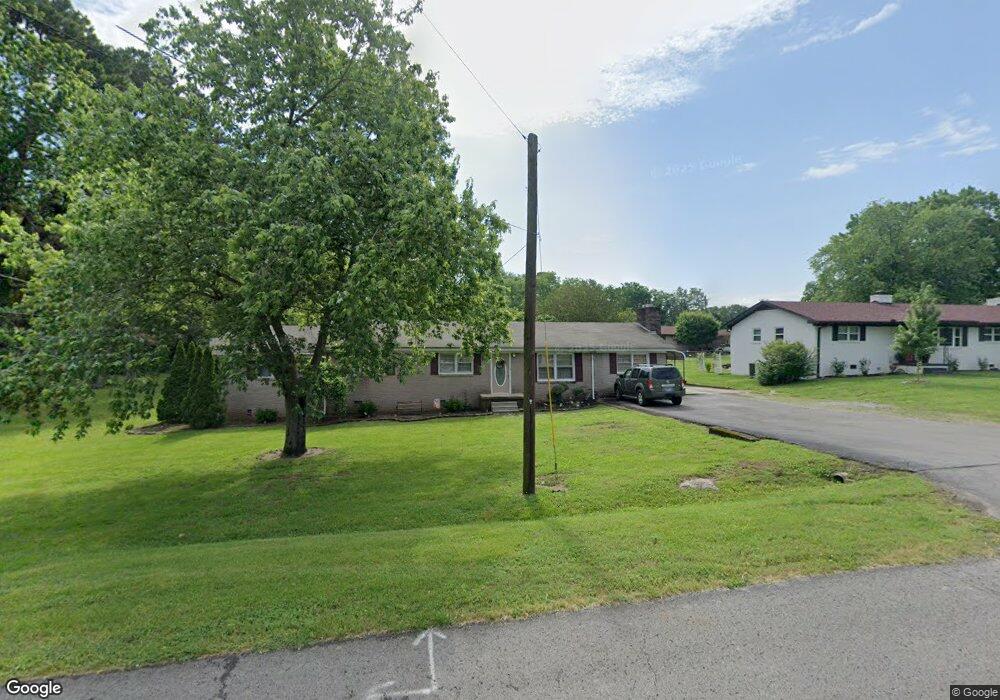
201 S Linda Dr Shelbyville, TN 37160
Estimated Value: $223,000 - $388,000
--
Bed
2
Baths
2,478
Sq Ft
$125/Sq Ft
Est. Value
About This Home
This home is located at 201 S Linda Dr, Shelbyville, TN 37160 and is currently estimated at $309,023, approximately $124 per square foot. 201 S Linda Dr is a home located in Bedford County with nearby schools including South Side Elementary School, Harris Middle School, and Christian Chapel Academy.
Ownership History
Date
Name
Owned For
Owner Type
Purchase Details
Closed on
Dec 1, 2022
Sold by
Williams Kevin Wayne
Bought by
Williams Kevin Wayne and Williams Karyn
Current Estimated Value
Home Financials for this Owner
Home Financials are based on the most recent Mortgage that was taken out on this home.
Original Mortgage
$176,776
Outstanding Balance
$84,163
Interest Rate
6.95%
Mortgage Type
Construction
Estimated Equity
$224,860
Purchase Details
Closed on
Sep 19, 2006
Sold by
Secretary Of Housing & Urb
Bought by
Williams Kevin Wayne
Purchase Details
Closed on
Apr 25, 2002
Sold by
Bryant Mark and Bryant Gloria
Bought by
Mckin Billy and Mckin Tina
Purchase Details
Closed on
Jun 9, 1988
Bought by
Hargrove Robert Don
Purchase Details
Closed on
Jun 30, 1976
Bought by
Hargrove Robert Don and Hargrove Nettie M
Create a Home Valuation Report for This Property
The Home Valuation Report is an in-depth analysis detailing your home's value as well as a comparison with similar homes in the area
Home Values in the Area
Average Home Value in this Area
Purchase History
| Date | Buyer | Sale Price | Title Company |
|---|---|---|---|
| Williams Kevin Wayne | -- | -- | |
| Williams Kevin Wayne | $76,075 | -- | |
| Mckin Billy | $109,000 | -- | |
| Hargrove Robert Don | -- | -- | |
| Hargrove Robert Don | -- | -- |
Source: Public Records
Mortgage History
| Date | Status | Borrower | Loan Amount |
|---|---|---|---|
| Open | Williams Kevin Wayne | $176,776 |
Source: Public Records
Tax History Compared to Growth
Tax History
| Year | Tax Paid | Tax Assessment Tax Assessment Total Assessment is a certain percentage of the fair market value that is determined by local assessors to be the total taxable value of land and additions on the property. | Land | Improvement |
|---|---|---|---|---|
| 2025 | -- | $49,700 | $0 | $0 |
| 2024 | -- | $49,700 | $6,000 | $43,700 |
| 2023 | $1,892 | $49,700 | $6,000 | $43,700 |
| 2022 | $1,946 | $49,700 | $6,000 | $43,700 |
| 2021 | $1,767 | $49,700 | $6,000 | $43,700 |
| 2020 | $1,472 | $49,700 | $6,000 | $43,700 |
| 2019 | $1,472 | $33,225 | $4,625 | $28,600 |
| 2018 | $1,439 | $33,225 | $4,625 | $28,600 |
| 2017 | $1,439 | $33,225 | $4,625 | $28,600 |
| 2016 | $1,425 | $33,225 | $4,625 | $28,600 |
| 2015 | $1,425 | $33,225 | $4,625 | $28,600 |
| 2014 | $1,363 | $34,766 | $0 | $0 |
Source: Public Records
Map
Nearby Homes