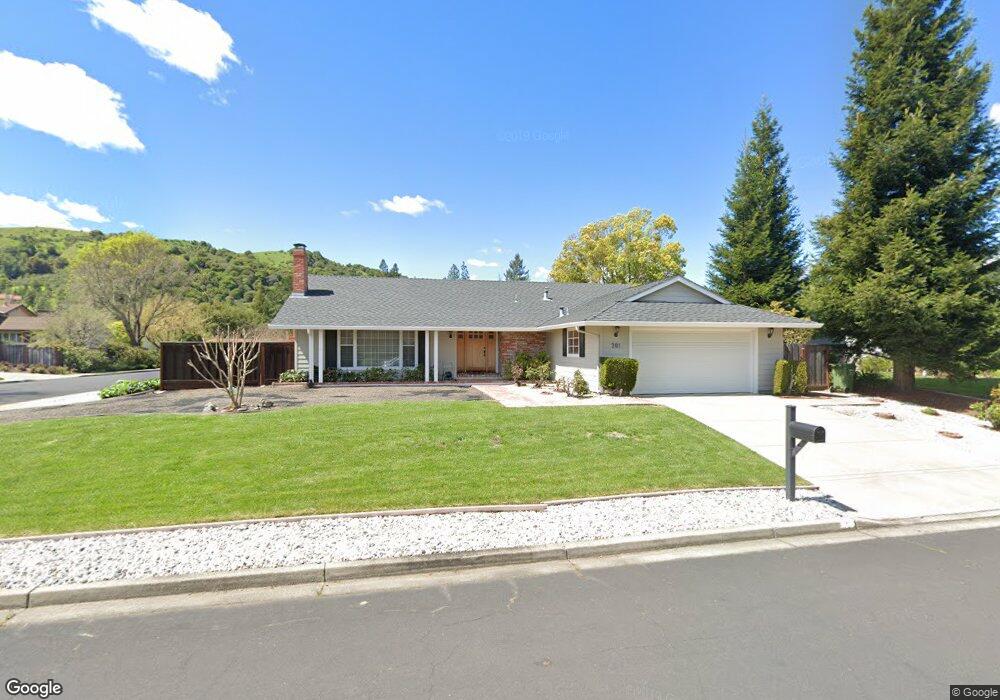
201 Sheila Ct Moraga, CA 94556
Estimated Value: $1,447,000 - $1,571,000
3
Beds
2
Baths
1,641
Sq Ft
$919/Sq Ft
Est. Value
About This Home
This home is located at 201 Sheila Ct, Moraga, CA 94556 and is currently estimated at $1,508,508, approximately $919 per square foot. 201 Sheila Ct is a home located in Contra Costa County with nearby schools including Los Perales Elementary School, Joaquin Moraga Intermediate School, and Campolindo High School.
Ownership History
Date
Name
Owned For
Owner Type
Purchase Details
Closed on
Apr 11, 2024
Sold by
Davis Elaine Chow
Bought by
Ehcd Trust and Chow-Davis
Current Estimated Value
Purchase Details
Closed on
Jun 22, 2021
Sold by
Bergen John A
Bought by
Bergen John A and The John A Bergen Trust
Purchase Details
Closed on
Apr 7, 2003
Sold by
Chow Zenia Chan
Bought by
Davis Elaine Chow
Purchase Details
Closed on
Jul 18, 1997
Sold by
Chow Zenia
Bought by
Chow Zenia Chan
Purchase Details
Closed on
Mar 18, 1997
Sold by
Chow Tseng Yeh
Bought by
Chow Zenia
Purchase Details
Closed on
Mar 12, 1997
Sold by
Eichelberger Jack S & J M Tre
Bought by
Chow Zenia
Purchase Details
Closed on
Aug 31, 1994
Sold by
Eichelberger Jack S and Eichelberger Jacqueline M
Bought by
Eichelberger Jack S and Eichelberger Jacqueline M
Create a Home Valuation Report for This Property
The Home Valuation Report is an in-depth analysis detailing your home's value as well as a comparison with similar homes in the area
Purchase History
| Date | Buyer | Sale Price | Title Company |
|---|---|---|---|
| Ehcd Trust | -- | None Listed On Document | |
| Bergen John A | -- | None Available | |
| Davis Elaine Chow | -- | -- | |
| Chow Zenia Chan | -- | -- | |
| Chow Zenia | -- | -- | |
| Chow Zenia | -- | Placer Title Company | |
| Chow Zenia | $385,000 | Placer Title | |
| Eichelberger Jack S | -- | -- |
Source: Public Records
Tax History
| Year | Tax Paid | Tax Assessment Tax Assessment Total Assessment is a certain percentage of the fair market value that is determined by local assessors to be the total taxable value of land and additions on the property. | Land | Improvement |
|---|---|---|---|---|
| 2025 | $8,752 | $627,029 | $423,453 | $203,576 |
| 2024 | $8,290 | $614,735 | $415,150 | $199,585 |
| 2023 | $8,290 | $602,682 | $407,010 | $195,672 |
| 2022 | $8,168 | $590,866 | $399,030 | $191,836 |
| 2021 | $8,041 | $579,281 | $391,206 | $188,075 |
| 2019 | $7,900 | $562,101 | $379,603 | $182,498 |
| 2018 | $7,631 | $551,080 | $372,160 | $178,920 |
| 2017 | $7,505 | $540,275 | $364,863 | $175,412 |
| 2016 | $7,218 | $529,682 | $357,709 | $171,973 |
| 2015 | $7,150 | $521,726 | $352,336 | $169,390 |
| 2014 | $7,058 | $511,507 | $345,435 | $166,072 |
Source: Public Records
Map
Nearby Homes
- 1418 De la Cruz Way
- 34 Sherwood Ct
- 826 Augusta Dr
- 1020 Sanders Dr
- 6 Sparrow Ct
- 7 Doral Dr
- 118 Merion Terrace
- 769 Augusta Dr
- 1066 Larch Ave
- 1585 Moraga Way Unit 11
- 1209 Rimer Dr
- 1124 Sanders Dr
- 201 Willowbrook Ln
- 923 Camino Ricardo
- 809 Villa Ln Unit 2
- 183 Miramonte Dr
- 187 Miramonte Dr
- 47 Miramonte Dr
- 37 Miramonte Dr
- 18 Miramonte Dr
- 207 Sheila Ct
- 1409 De la Cruz Way
- 26 Kinston Ct
- 200 Sheila Ct
- 1410 De la Cruz Way
- 206 Sheila Ct
- 215 Sheila Ct
- 1401 De la Cruz Way
- 1875 School St
- 1426 De la Cruz Way
- 31 Kinston Ct
- 20 Kinston Ct
- 212 Sheila Ct
- 47 Rick Ct
- 1883 School St
- 219 Sheila Ct
- 53 Rick Ct
- 27 Kinston Ct
- 218 Sheila Ct
- 1891 School St
Your Personal Tour Guide
Ask me questions while you tour the home.