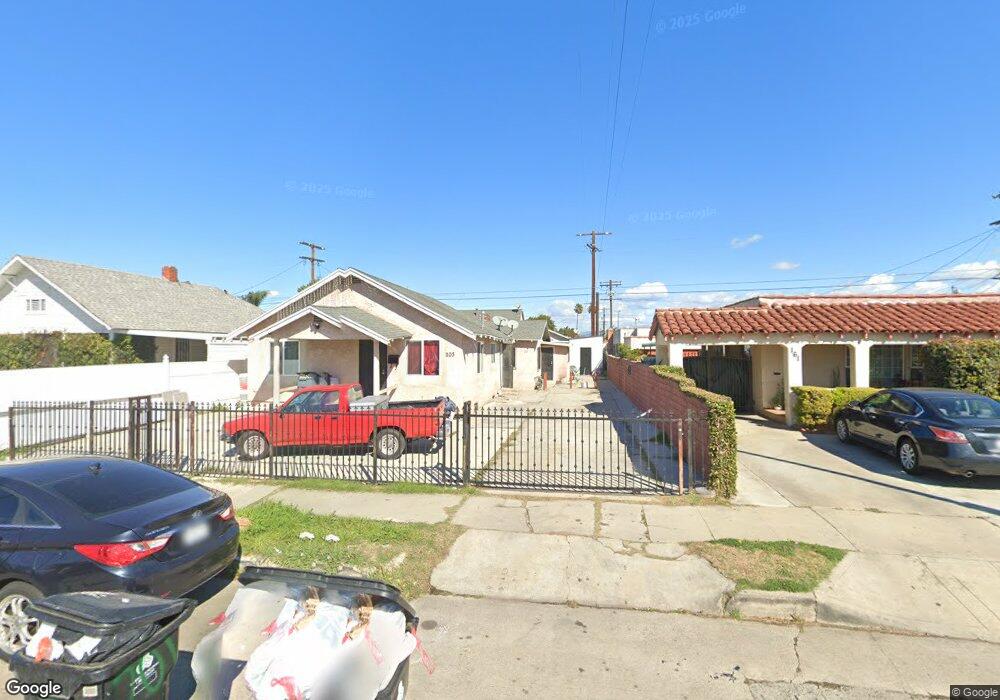
201 W 65th St Los Angeles, CA 90003
Florence NeighborhoodEstimated Value: $639,000 - $726,000
5
Beds
3
Baths
1,799
Sq Ft
$377/Sq Ft
Est. Value
About This Home
This home is located at 201 W 65th St, Los Angeles, CA 90003 and is currently estimated at $678,124, approximately $376 per square foot. 201 W 65th St is a home located in Los Angeles County with nearby schools including Mary McLeod Bethune Middle School, Academy For Multiligual Arts And Science At Mervyn M. Dymally High, and Aspire Slauson Academy.
Ownership History
Date
Name
Owned For
Owner Type
Purchase Details
Closed on
Mar 14, 2008
Sold by
Lee Israel James
Bought by
Velasquez Julian Mauricio
Current Estimated Value
Home Financials for this Owner
Home Financials are based on the most recent Mortgage that was taken out on this home.
Original Mortgage
$224,000
Interest Rate
5.88%
Mortgage Type
Purchase Money Mortgage
Purchase Details
Closed on
Nov 15, 1999
Sold by
Lee Arline
Bought by
Boyd Arline and Lee Isreal James
Create a Home Valuation Report for This Property
The Home Valuation Report is an in-depth analysis detailing your home's value as well as a comparison with similar homes in the area
Home Values in the Area
Average Home Value in this Area
Purchase History
| Date | Buyer | Sale Price | Title Company |
|---|---|---|---|
| Velasquez Julian Mauricio | $320,000 | Fatcola | |
| Boyd Arline | -- | -- |
Source: Public Records
Mortgage History
| Date | Status | Borrower | Loan Amount |
|---|---|---|---|
| Previous Owner | Velasquez Julian Mauricio | $224,000 |
Source: Public Records
Tax History Compared to Growth
Tax History
| Year | Tax Paid | Tax Assessment Tax Assessment Total Assessment is a certain percentage of the fair market value that is determined by local assessors to be the total taxable value of land and additions on the property. | Land | Improvement |
|---|---|---|---|---|
| 2025 | $5,319 | $420,304 | $236,422 | $183,882 |
| 2024 | $5,319 | $412,064 | $231,787 | $180,277 |
| 2023 | $5,221 | $403,986 | $227,243 | $176,743 |
| 2022 | $4,986 | $396,066 | $222,788 | $173,278 |
| 2021 | $4,919 | $388,301 | $218,420 | $169,881 |
| 2020 | $4,965 | $384,561 | $216,181 | $168,380 |
| 2019 | $4,777 | $377,027 | $211,943 | $165,084 |
| 2018 | $4,691 | $369,640 | $207,788 | $161,852 |
| 2016 | $4,474 | $355,058 | $199,720 | $155,338 |
| 2015 | $4,411 | $349,726 | $196,721 | $153,005 |
| 2014 | $4,443 | $342,876 | $192,868 | $150,008 |
Source: Public Records
Map
Nearby Homes