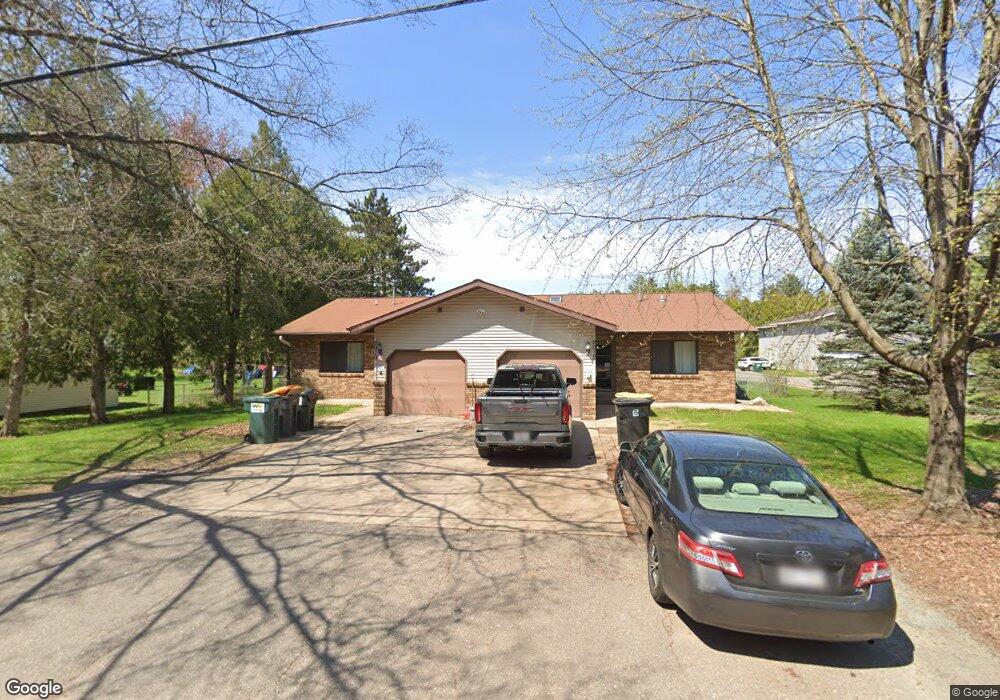
2010 Bloedel Ave Unit 2012 Schofield, WI 54476
Estimated Value: $205,000 - $394,000
Studio
--
Bath
2,200
Sq Ft
$150/Sq Ft
Est. Value
About This Home
This home is located at 2010 Bloedel Ave Unit 2012, Schofield, WI 54476 and is currently estimated at $329,333, approximately $149 per square foot. 2010 Bloedel Ave Unit 2012 is a home located in Marathon County with nearby schools including Weston Elementary School, D.C. Everest Junior High School, and D.C. Everest Middle School.
Ownership History
Date
Name
Owned For
Owner Type
Purchase Details
Closed on
Dec 31, 2019
Sold by
Dbs Properties Llc
Bought by
Schrader Properties Llc
Current Estimated Value
Purchase Details
Closed on
Aug 1, 2014
Sold by
Fresia Jeffrey G and Fresia Mary T
Bought by
Dbs Properties Llc
Purchase Details
Closed on
Mar 31, 2011
Sold by
Krumpos John D and Krumpos Sandra L
Bought by
Fresia Jeffrey G and Fresia Mary T
Home Financials for this Owner
Home Financials are based on the most recent Mortgage that was taken out on this home.
Original Mortgage
$126,000
Interest Rate
4.99%
Mortgage Type
Unknown
Purchase Details
Closed on
Sep 29, 2006
Sold by
Clarity Capital Llc
Bought by
Krumpos John D and Krumpos Sandra L
Home Financials for this Owner
Home Financials are based on the most recent Mortgage that was taken out on this home.
Original Mortgage
$60,000
Interest Rate
6.49%
Mortgage Type
Unknown
Create a Home Valuation Report for This Property
The Home Valuation Report is an in-depth analysis detailing your home's value as well as a comparison with similar homes in the area
Home Values in the Area
Average Home Value in this Area
Purchase History
| Date | Buyer | Sale Price | Title Company |
|---|---|---|---|
| Schrader Properties Llc | $192,500 | None Available | |
| Dbs Properties Llc | $290,000 | Gowey Abstract & Title | |
| Fresia Jeffrey G | $169,500 | None Available | |
| Krumpos John D | $187,000 | None Available |
Source: Public Records
Mortgage History
| Date | Status | Borrower | Loan Amount |
|---|---|---|---|
| Previous Owner | Fresia Jeffrey G | $126,000 | |
| Previous Owner | Krumpos John D | $60,000 |
Source: Public Records
Tax History
| Year | Tax Paid | Tax Assessment Tax Assessment Total Assessment is a certain percentage of the fair market value that is determined by local assessors to be the total taxable value of land and additions on the property. | Land | Improvement |
|---|---|---|---|---|
| 2025 | $6,104 | $367,900 | $55,500 | $312,400 |
| 2024 | $6,164 | $367,900 | $55,500 | $312,400 |
| 2023 | $4,970 | $198,500 | $55,500 | $143,000 |
| 2022 | $5,183 | $198,500 | $55,500 | $143,000 |
| 2021 | $5,054 | $198,500 | $55,500 | $143,000 |
| 2020 | $4,942 | $198,500 | $55,500 | $143,000 |
| 2019 | $4,852 | $198,500 | $55,500 | $143,000 |
| 2018 | $4,290 | $198,500 | $55,500 | $143,000 |
| 2017 | $4,485 | $198,500 | $55,500 | $143,000 |
| 2016 | $4,367 | $195,000 | $55,500 | $139,500 |
| 2015 | $3,895 | $192,800 | $55,500 | $137,300 |
| 2014 | $3,850 | $192,800 | $55,500 | $137,300 |
Source: Public Records
Map
Nearby Homes
- 2007 Bloedel Ave
- 1919 Schofield Ave Unit 3.89 acres
- 5902 Coronado Dr
- 5906 Lawndale St
- 1118 Mason St
- 3006 Barclay Way
- 1448 Grand Ave
- 1719 Foothill Ave
- 6399 Birch St Unit 275
- 1216 Grand Ave
- 5908 Edward St Unit 5910
- 6300 Birch St Unit 219
- 1030 Grand Ave
- 3802 & 3804 Ross Ave
- 1705 Hemlock Ave
- 7320 Whitespire Rd Unit 15
- 000 Community Center Dr Unit Parcel 2
- 000 Community Center Dr Unit Parcel 3
- 5210 Camp Phillips Rd
- 7601 Stonefield Trail
- 2008 Bloedel Ave
- 2014 Bloedel Ave Unit 2104
- 2017 Bloedel Ave
- 2002 Bloedel Ave
- 2106 Bloedel Ave Unit 2108
- 2105 Bloedel Ave
- 2003 Bloedel Ave
- 5508 Cherry St Unit 5510
- 2109 Bloedel Ave
- 5512 Cherry St Unit 5514
- 2020 Neupert Ave
- 1915 Bloedel Ave
- 2102 Neupert Ave
- 5506 Cherry St
- 2002 Neupert Ave
- 2111 Bloedel Ave
- 1911 Bloedel Ave
- 2104 Neupert Ave
- 5420 Cherry St
- 1907 Bloedel Ave Unit 4-Upper
Your Personal Tour Guide
Ask me questions while you tour the home.