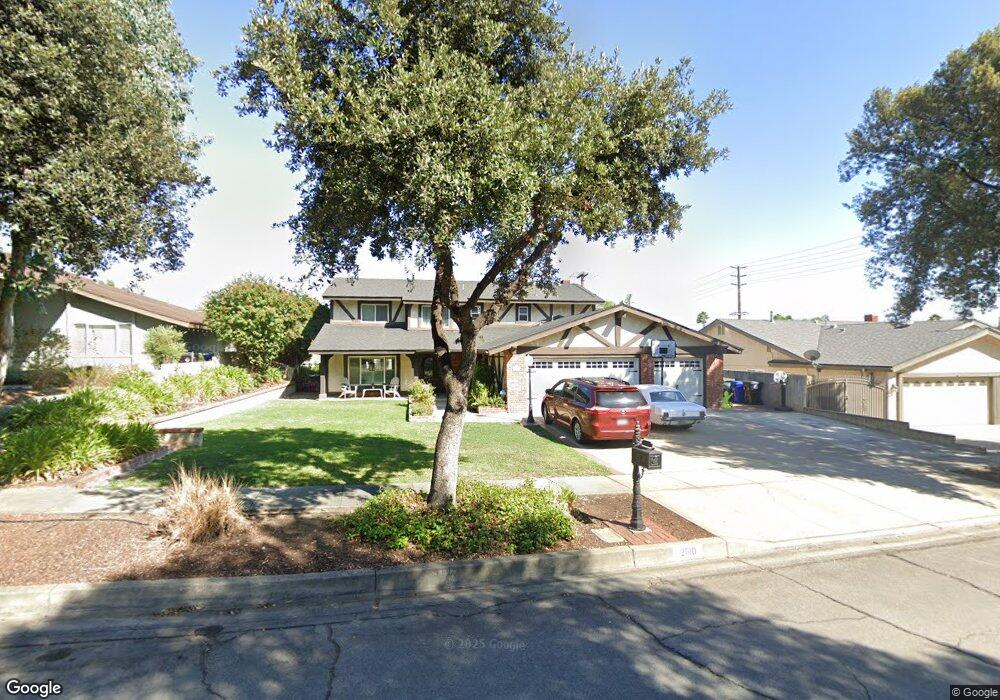
2010 N Albright Ave Upland, CA 91784
Estimated Value: $1,004,123 - $1,151,000
5
Beds
3
Baths
2,778
Sq Ft
$395/Sq Ft
Est. Value
About This Home
This home is located at 2010 N Albright Ave, Upland, CA 91784 and is currently estimated at $1,097,281, approximately $394 per square foot. 2010 N Albright Ave is a home located in San Bernardino County with nearby schools including Valencia Elementary, Pioneer Junior High School, and Upland High School.
Ownership History
Date
Name
Owned For
Owner Type
Purchase Details
Closed on
Apr 26, 2017
Sold by
Burke Margaret R
Bought by
Richardson Ian and Burke Margaret R
Current Estimated Value
Purchase Details
Closed on
May 4, 2016
Sold by
Richardson Ian
Bought by
Burke Margaret R and Burke Thomas D
Purchase Details
Closed on
May 15, 1998
Sold by
Richardson Ian and Richardson Sarah E
Bought by
Richardson Ian and Richardson Sarah E
Create a Home Valuation Report for This Property
The Home Valuation Report is an in-depth analysis detailing your home's value as well as a comparison with similar homes in the area
Home Values in the Area
Average Home Value in this Area
Purchase History
| Date | Buyer | Sale Price | Title Company |
|---|---|---|---|
| Richardson Ian | -- | None Available | |
| Burke Margaret R | -- | North American Title Co | |
| Richardson Ian | -- | -- |
Source: Public Records
Tax History Compared to Growth
Tax History
| Year | Tax Paid | Tax Assessment Tax Assessment Total Assessment is a certain percentage of the fair market value that is determined by local assessors to be the total taxable value of land and additions on the property. | Land | Improvement |
|---|---|---|---|---|
| 2025 | $4,118 | $384,214 | $89,653 | $294,561 |
| 2024 | $4,118 | $376,680 | $87,895 | $288,785 |
| 2023 | $4,054 | $369,295 | $86,172 | $283,123 |
| 2022 | $3,965 | $362,054 | $84,482 | $277,572 |
| 2021 | $3,958 | $354,954 | $82,825 | $272,129 |
| 2020 | $3,850 | $351,315 | $81,976 | $269,339 |
| 2019 | $3,836 | $344,427 | $80,369 | $264,058 |
| 2018 | $5,196 | $472,604 | $141,274 | $331,330 |
| 2017 | $3,633 | $331,038 | $77,244 | $253,794 |
| 2016 | $3,429 | $324,547 | $75,729 | $248,818 |
| 2015 | $3,350 | $319,672 | $74,591 | $245,081 |
| 2014 | $3,263 | $313,410 | $73,130 | $240,280 |
Source: Public Records
Map
Nearby Homes
- 907 Pineridge St
- 666 W 21st St
- 1931 N Redding Way
- 874 W 19th St
- 785 W Dalton Ct
- 1842 Balboa Way
- 351 W Buffington St
- 1817 N Vallejo Way
- 1817 Balboa Way
- 211 Deborah Ct
- 1788 N Coolcrest Ave
- 1992 Moonbeam Cir
- 1243 Jacaranda Place
- 860 Emerson St
- 937 Emerson St
- 1310 Brookside Ct
- 1754 N Tulare Way
- 1739 N Tulare Way
- 1745 N Redding Way
- 1328 Sunrise Cir S
- 2016 N Albright Ave
- 2002 N Albright Ave
- 2022 N Albright Ave
- 833 W 20th St
- 2028 N Albright Ave
- 845 W 20th St
- 2015 N Albright Ave
- 808 W 20th St
- 834 W Rae Ct
- 814 W 20th St
- 2034 N Albright Ave
- 853 W 20th St
- 824 W 20th St
- 786 W 20th St
- 836 W 20th St
- 846 W Rae Ct
- 2040 N Albright Ave
- 807 Kenwood St
- 817 Kenwood St
- 850 W 20th St