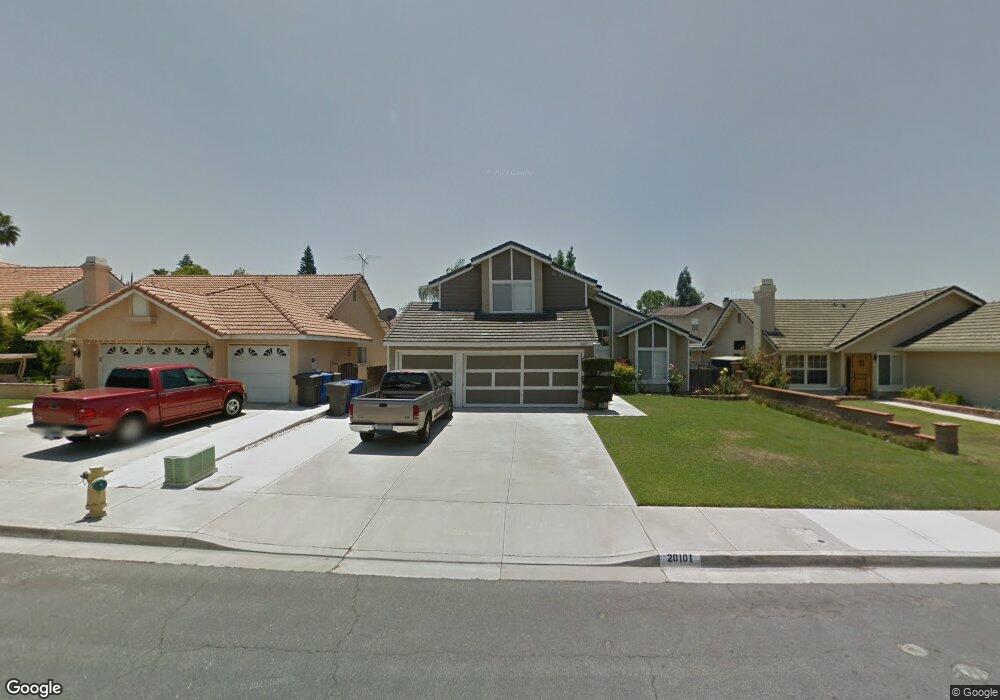
20101 Whiterock Ln Riverside, CA 92508
Orangecrest NeighborhoodEstimated Value: $706,000 - $752,000
4
Beds
3
Baths
2,197
Sq Ft
$331/Sq Ft
Est. Value
About This Home
This home is located at 20101 Whiterock Ln, Riverside, CA 92508 and is currently estimated at $726,713, approximately $330 per square foot. 20101 Whiterock Ln is a home located in Riverside County with nearby schools including Tomas Rivera Elementary School, Amelia Earhart Middle School, and Martin Luther King Junior High School.
Ownership History
Date
Name
Owned For
Owner Type
Purchase Details
Closed on
Jun 18, 2018
Sold by
Chew Paul D and Chew Alba M
Bought by
Chew Paul D and Chew Alba Marina
Current Estimated Value
Purchase Details
Closed on
Mar 5, 2013
Sold by
Chew Paul Dean and Chew Alba
Bought by
Chew Paul D and Chew Alba M
Home Financials for this Owner
Home Financials are based on the most recent Mortgage that was taken out on this home.
Original Mortgage
$200,700
Outstanding Balance
$140,727
Interest Rate
3.4%
Mortgage Type
New Conventional
Estimated Equity
$585,986
Purchase Details
Closed on
Nov 22, 2000
Sold by
Chew Paul Dean
Bought by
Chew Paul Dean and Chew Alba
Purchase Details
Closed on
Nov 15, 1993
Sold by
Chew Julie
Bought by
Chew Paul Dean
Home Financials for this Owner
Home Financials are based on the most recent Mortgage that was taken out on this home.
Original Mortgage
$176,578
Interest Rate
6.74%
Mortgage Type
VA
Create a Home Valuation Report for This Property
The Home Valuation Report is an in-depth analysis detailing your home's value as well as a comparison with similar homes in the area
Home Values in the Area
Average Home Value in this Area
Purchase History
| Date | Buyer | Sale Price | Title Company |
|---|---|---|---|
| Chew Paul D | -- | None Available | |
| Chew Paul D | -- | Lawyers Title Company | |
| Chew Paul Dean | -- | First American Title Co | |
| Chew Paul Dean | -- | Fidelity National Title |
Source: Public Records
Mortgage History
| Date | Status | Borrower | Loan Amount |
|---|---|---|---|
| Open | Chew Paul D | $200,700 | |
| Closed | Chew Paul Dean | $176,578 |
Source: Public Records
Tax History
| Year | Tax Paid | Tax Assessment Tax Assessment Total Assessment is a certain percentage of the fair market value that is determined by local assessors to be the total taxable value of land and additions on the property. | Land | Improvement |
|---|---|---|---|---|
| 2025 | $3,116 | $291,372 | $88,390 | $202,982 |
| 2023 | $3,116 | $280,058 | $84,958 | $195,100 |
| 2022 | $3,043 | $274,568 | $83,293 | $191,275 |
| 2021 | $3,009 | $269,185 | $81,660 | $187,525 |
| 2020 | $2,986 | $266,426 | $80,823 | $185,603 |
| 2019 | $2,928 | $261,203 | $79,239 | $181,964 |
| 2018 | $2,870 | $256,083 | $77,687 | $178,396 |
| 2017 | $2,957 | $251,063 | $76,164 | $174,899 |
| 2016 | $2,838 | $246,141 | $74,671 | $171,470 |
| 2015 | $2,809 | $242,446 | $73,550 | $168,896 |
| 2014 | $2,824 | $237,699 | $72,110 | $165,589 |
Source: Public Records
Map
Nearby Homes
- 19972 Windwood Cir
- 19971 Westerly Dr
- 20228 June Ct
- 19920 Silvercrest Ln
- 19911 Westerly Dr
- 20329 Red Poppy Ln
- 9036 Limecrest Dr
- 19629 Capital Peak Ln
- 8470 Lindenhurst St
- 0 Apn#267-180-003 Unit CV22145370
- 0 Old Frontage Rd Unit OC25137111
- 20628 Mesa Oak Dr
- 19689 Allenhurst St
- 9131 Santa Barbara Dr
- 20567 Nathan Dr
- 8430 Bess Ct
- 8449 Monique Ct
- 8634 Cabin Place
- 19435 Fortunello Ave
- 19452 Fortunello Ave
- 20093 Whiterock Ln
- 20111 Whiterock Ln
- 0 White St Unit I12013121
- 0 White St Unit I12013104
- 20073 Whiterock Ln
- 20121 Whiterock Ln
- 20102 Sweetbay Rd
- 20112 Sweetbay Rd
- 20094 Sweetbay Rd
- 20122 Sweetbay Rd
- 20074 Sweetbay Rd
- 20053 Whiterock Ln
- 20131 Whiterock Ln
- 8751 Rosebay Ct
- 8750 Rosebay Ct
- 20054 Sweetbay Rd
- 20132 Sweetbay Rd
- 20033 Whiterock Ln
- 20141 Whiterock Ln
- 8741 Rosebay Ct
Your Personal Tour Guide
Ask me questions while you tour the home.