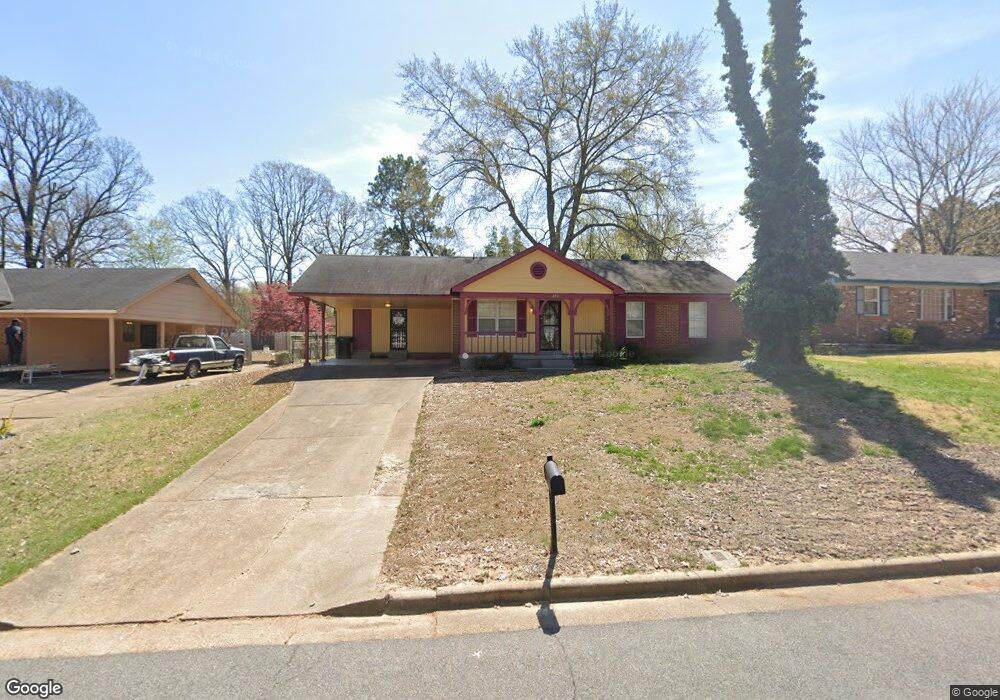
2011 Argosy Dr Memphis, TN 38116
Whitehaven NeighborhoodEstimated Value: $144,576 - $163,000
3
Beds
2
Baths
1,144
Sq Ft
$131/Sq Ft
Est. Value
About This Home
This home is located at 2011 Argosy Dr, Memphis, TN 38116 and is currently estimated at $149,894, approximately $131 per square foot. 2011 Argosy Dr is a home located in Shelby County with nearby schools including Oakshire Elementary School, Havenview Middle School, and Whitehaven High School.
Ownership History
Date
Name
Owned For
Owner Type
Purchase Details
Closed on
Dec 17, 2002
Sold by
C V Butler Construction Llc
Bought by
Moore Odessa C
Current Estimated Value
Home Financials for this Owner
Home Financials are based on the most recent Mortgage that was taken out on this home.
Original Mortgage
$77,000
Outstanding Balance
$32,480
Interest Rate
5.99%
Estimated Equity
$117,414
Purchase Details
Closed on
Apr 27, 2001
Sold by
Miller Jessalyn R
Bought by
Hud
Purchase Details
Closed on
Aug 16, 1996
Sold by
Hodge Albert G and Hodge Carolyn L
Bought by
Miller Jessalyn
Home Financials for this Owner
Home Financials are based on the most recent Mortgage that was taken out on this home.
Original Mortgage
$62,679
Interest Rate
8.4%
Mortgage Type
FHA
Create a Home Valuation Report for This Property
The Home Valuation Report is an in-depth analysis detailing your home's value as well as a comparison with similar homes in the area
Home Values in the Area
Average Home Value in this Area
Purchase History
| Date | Buyer | Sale Price | Title Company |
|---|---|---|---|
| Moore Odessa C | $77,000 | -- | |
| Hud | $67,777 | -- | |
| Miller Jessalyn | $62,000 | Security Title Company Inc |
Source: Public Records
Mortgage History
| Date | Status | Borrower | Loan Amount |
|---|---|---|---|
| Open | Moore Odessa C | $77,000 | |
| Previous Owner | Miller Jessalyn | $62,679 |
Source: Public Records
Tax History Compared to Growth
Tax History
| Year | Tax Paid | Tax Assessment Tax Assessment Total Assessment is a certain percentage of the fair market value that is determined by local assessors to be the total taxable value of land and additions on the property. | Land | Improvement |
|---|---|---|---|---|
| 2025 | $779 | $33,875 | $6,325 | $27,550 |
| 2024 | $779 | $22,975 | $4,300 | $18,675 |
| 2023 | $1,400 | $22,975 | $4,300 | $18,675 |
| 2022 | $1,400 | $22,975 | $4,300 | $18,675 |
| 2021 | $1,416 | $22,975 | $4,300 | $18,675 |
| 2020 | $1,225 | $16,900 | $4,300 | $12,600 |
| 2019 | $1,225 | $16,900 | $4,300 | $12,600 |
| 2018 | $1,225 | $16,900 | $4,300 | $12,600 |
| 2017 | $695 | $16,900 | $4,300 | $12,600 |
| 2016 | $739 | $16,900 | $0 | $0 |
| 2014 | $739 | $16,900 | $0 | $0 |
Source: Public Records
Map
Nearby Homes
- 5273 Chatfield Dr Unit 63B
- 5338 Hickman St
- 1889 Pomona Ave
- 5452 Jordan Dr
- 5065 Dianne Dr
- 5059 Dianne Dr
- 1749 Pomona Ave
- 1763 Buxton Rd
- 4898 Dianne Dr
- 5449 Millbranch Rd
- 1776 First Green Unit 21 Dr Unit 21
- 5387 Loch Lomond Rd
- 1639 Kilarney Ave
- 4993 Millbranch Rd
- 1768 Second Green Dr Unit 50
- 4970 Lochinvar Dr
- 5025 Loch Lomond Rd
- 1759 Club Green Dr Unit 67
- 5245 Villa Del Rey Dr
- 1502 Mary Jane Ave
- 2019 Argosy Dr
- 2005 Argosy Dr
- 2030 Pomona Ave
- 1999 Argosy Dr
- 2036 Pomona Ave
- 2024 Pomona Ave
- 2029 Argosy Dr
- 2014 Argosy Dr
- 2008 Argosy Dr
- 5261 Apollo St
- 2020 Argosy Dr
- 2002 Argosy Dr
- 1995 Argosy Dr
- 2020 Pomona Ave
- 2044 Pomona Ave
- 2044 Pomona Ave Unit ID1043839P
- 2028 Argosy Dr
- 1996 Argosy Dr
- 2014 Pomona Ave
- 1989 Argosy Dr