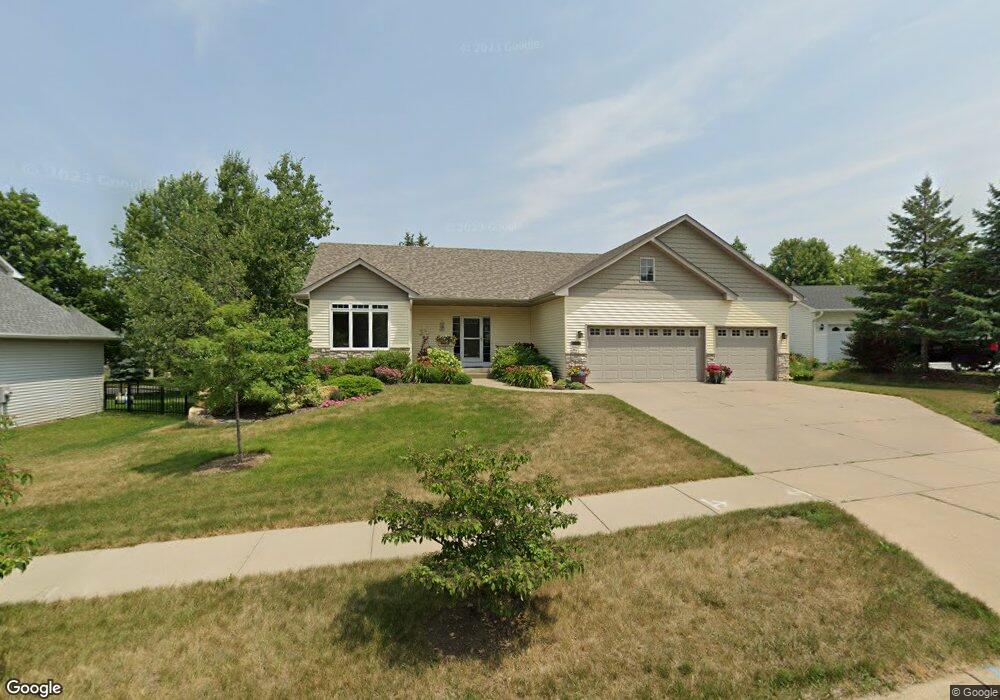
2011 Grant Dr Northfield, MN 55057
Estimated Value: $520,359 - $558,000
4
Beds
3
Baths
1,605
Sq Ft
$340/Sq Ft
Est. Value
About This Home
This home is located at 2011 Grant Dr, Northfield, MN 55057 and is currently estimated at $546,340, approximately $340 per square foot. 2011 Grant Dr is a home located in Rice County with nearby schools including Bridgewater Elementary School, Northfield Middle School, and Northfield Senior High School.
Ownership History
Date
Name
Owned For
Owner Type
Purchase Details
Closed on
Jul 5, 2017
Sold by
Wang Esther and Carter David M
Bought by
Evans Susan C and Susan C Evans Trust
Current Estimated Value
Home Financials for this Owner
Home Financials are based on the most recent Mortgage that was taken out on this home.
Original Mortgage
$213,500
Outstanding Balance
$177,431
Interest Rate
3.9%
Mortgage Type
New Conventional
Estimated Equity
$368,909
Purchase Details
Closed on
May 14, 2004
Sold by
Deutsch Construction Inc
Bought by
Lovelace Timothy and Wang Esther
Create a Home Valuation Report for This Property
The Home Valuation Report is an in-depth analysis detailing your home's value as well as a comparison with similar homes in the area
Home Values in the Area
Average Home Value in this Area
Purchase History
| Date | Buyer | Sale Price | Title Company |
|---|---|---|---|
| Evans Susan C | $355,000 | None Available | |
| Lovelace Timothy | $329,569 | -- |
Source: Public Records
Mortgage History
| Date | Status | Borrower | Loan Amount |
|---|---|---|---|
| Open | Evans Susan C | $213,500 |
Source: Public Records
Tax History
| Year | Tax Paid | Tax Assessment Tax Assessment Total Assessment is a certain percentage of the fair market value that is determined by local assessors to be the total taxable value of land and additions on the property. | Land | Improvement |
|---|---|---|---|---|
| 2025 | $8,758 | $510,400 | $85,900 | $424,500 |
| 2024 | $8,758 | $480,100 | $79,500 | $400,600 |
| 2023 | $7,074 | $480,100 | $79,500 | $400,600 |
| 2022 | $6,462 | $437,900 | $77,300 | $360,600 |
| 2021 | $6,292 | $388,900 | $68,700 | $320,200 |
| 2020 | $6,078 | $374,000 | $69,400 | $304,600 |
| 2019 | $5,672 | $354,800 | $67,300 | $287,500 |
| 2018 | $5,504 | $328,600 | $62,900 | $265,700 |
| 2017 | $4,736 | $313,700 | $60,100 | $253,600 |
| 2016 | $4,572 | $294,600 | $60,100 | $234,500 |
| 2015 | $4,390 | $272,200 | $60,100 | $212,100 |
| 2014 | -- | $263,900 | $60,100 | $203,800 |
Source: Public Records
Map
Nearby Homes
- 1802 Van Buren Ct
- 2100 Taylor Ct
- 2215 Greenfield Dr E
- 1513 Senate Ln
- 1900 Jefferson Rd
- 2300 Pepper Ridge Ln
- XXXX Division St S
- 1301 Presidential Dr
- 2106 Sunnyview Ln
- Outlot Honeylocust Dr
- 501 Professional Dr
- 2620 Oak Lawn Dr
- 1908 Sibley View Ln
- 205 Linden Place S
- 1011 Poplar St
- 2432 Aspen St
- 301 Aster Dr
- 2718 Brockman Ct Unit 714
- 2505 Aspen St
- 2804 Oak Lawn Dr
Your Personal Tour Guide
Ask me questions while you tour the home.